
 |
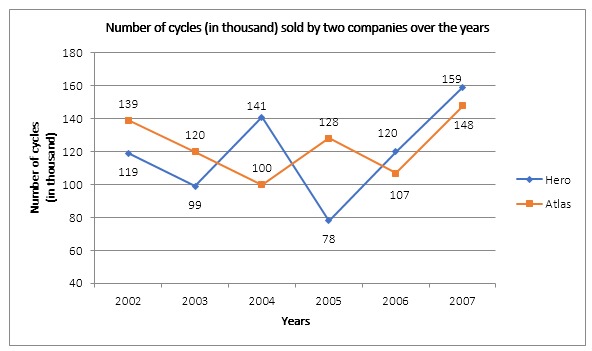
Q1. What is the difference between the number of cycles sold by company Atlas in 2004 and 2005?
(a) 50000
(b) 42000
(c) 33000
(d) 28000
(e) 27000
Q2. What is the difference between the total cycles sold by the two companies in the given years?
(a) 19000
(b) 22000
(c) 26000
(d) 28000
(e) 23000
Q3. What is the average numbers of cycles sold by Hero company over the given period? (rounded off to nearest integer)
(a) 119333
(b) 113666
(c) 112778
(d) 111223
(e) 111833
Q4. In which of the following year, the difference between the number of cycles sold by Hero company and Atlas is the maximum in the given years?
(a) 2002
(b) 2003
(c) 2004
(d) 2005
(e) 2007
Q5. The number of cycles sold by company Atlas in 2004 was approximately what per cent of the number of cycles sold by Hero company in the same year?
(a) 73%
(b) 111%
(c) 132%
(d) 80%
(e) 71%
Directions (6–10): Following bar diagram shows the monthly expenditure of two colonies i.e. P and Q on food, dressing, education, make up, electricity bill and miscellaneous (in percentage).
Study the line graph carefully to answer the following questions.
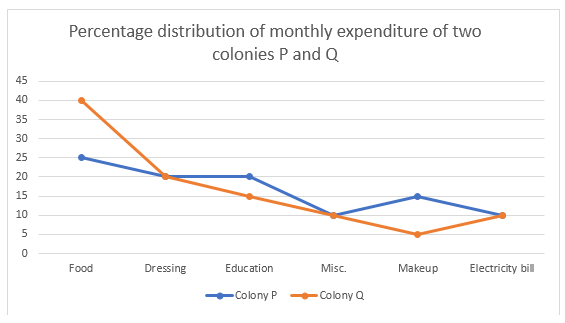
Q6. What fraction of the total expenditure is spent on Education in colony P?
(a) 2/5
(b) 1/5
(c) 3/5
(d) 4/5
(e) 5/7
Q7. If the total annual expenditure of colony Q is Rs. 1,00,000 then money spent on dresses during the year is:
(a) Rs. 2000
(b) Rs. 20000
(c) Rs. 6000
(d) Rs. 60000
(e) Rs. 24000
Q8. If the total annual expenditure of colony P is Rs. 3,00,000 then money spend on food, dresses and electricity bill during the year is:
(a) Rs. 1,65,000
(b) Rs. 1,80,000
(c) Rs. 2,10,000
(d) Rs. 1,50,000
(e) Rs. 1,25,000
Q9. If both the colonies have the same expenditure, which one spends more on education and miscellaneous together?
(a) colony P
(b) colony Q
(c) Both colonies spend same
(d) Can’t be determined
(e) None of these
Q10. If annual expenditures of colony P and colony Q are Rs.1,20,000 and Rs.1,08,000 respectively, then total monthly expenditure on makeup by colony P is how much percent more than that by colony Q?
(a) 400/3%
(b) 200/3%
(c) 700/3%
(d) 500/3%
(e) 550/3%
Directions (11-15): Study the following graph carefully to answer the questions that follow:
Number of students (in thousand) enrolled in three different colleges in six different years
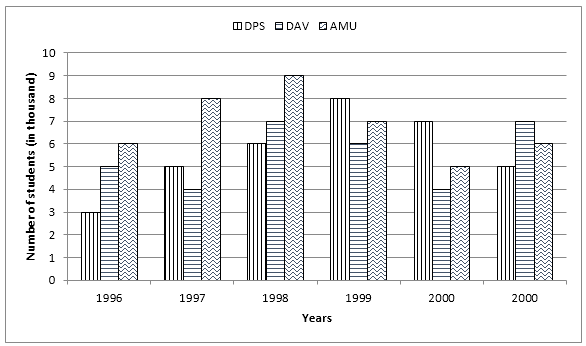
Q11. What was the percentage increase in enrolment in the number of students in AMU in year 1998 as compared to that in the previous year?
(a) 11.5
(b) 11.25
(c) 15.5
(d) 12.5
(e) 13.5
Q12. What was the difference between the number of students enrolled in all the three colleges together in the year 1999 and the number of students enrolled in DAV over all the years together?
(a) 12000
(b) 11000
(c) 1100
(d) 1400
(e) 14500
Q13. What was the approximate average number of students enrolled in DPS over all the years together?
(a) 5999
(b) 5666
(c) 5444
(d) 5333
(e) 6555
Q14. In which year was the number of students enrolled in all the three colleges together the second highest?
(a) 1997
(b) 1998
(c) 1999
(d) 2000
(e) 2001
Q15. Total number of students enrolled in DPS and DAV together in the year 2001 was what percentage of the total number of students enrolled in DPS in the year 1999?
(a) 150
(b) 120
(c) 250
(d) 220
(e) 350
 Quantitative Aptitude Quiz For IDBI AM/E...
 Quantitative Aptitude Quiz For IBPS RRB ...


