
Dear Readers,

It is time to pace up your preparation with New Pattern Questions of Quantitative Aptitude for SBI PO Prelims and NIACL Assistant Prelims 2017. These Quant questions will also help you in preparing for BOB PO and NICL AO 2017 recruitment examination.
Directions (Q.1–5): The following pie chart shows the distribution of Students of Engineering and Arts students enrolled in seven different universities. Read the following questions and answer it carefully.
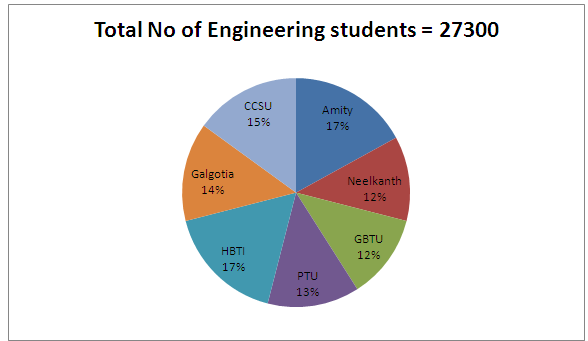
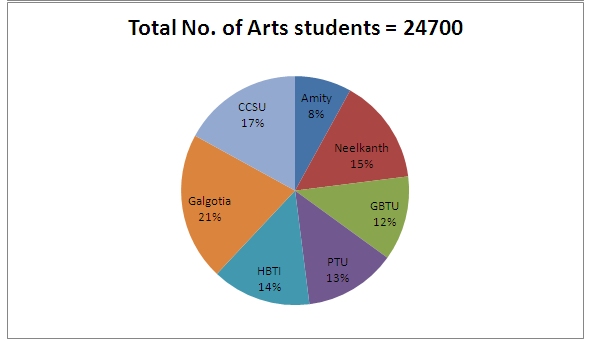
Q1. What is the total number of students of Engineering and Arts from Both GBTU and CCSU.?
(a) 13824
(b) 14534
(c) 12167
(d) 17576
(e) None of the above
Q2. What will be the ratio of no. of students from Neelkanth of both stream to the no. of students of Arts from HBTI and CCSU?
(a) 82 : 85
(b) 729 : 1089
(c) 829 : 1043
(d) 537:589
(e) None of these
Q3. What will be the difference between the average no of students of Arts from HBTI ,GBTU , Neelkanth & Amity Universities and average no of students of Engineering students from top 5 universities according to no of students enrolled?
(a) 1050
(b) 1193.85
(c) 1123.85
(d) 1089
(e) 1117
Q4. If one-third of engineering students to be enrolled in Galgotia changed their mind and joined Amity University instead. What will be the difference between new central angle of Both Galgotia and Amity University now?
(a) 54.4°
(b) 44.4°
(c) 47.6°
(d) 45.9°
(e) None of the above
Q5. 75% of engineering students passed in first year while 80% of arts students entered into second year. What is the difference between the no. of failed engineering students andtwo-third of passed Arts students?
(a) 6349
(b) 6400
(c) 6449
(d) 6198
(e) 6000
Directions (Q.6 – 10): Study the following pie chart shows the percentage of the total number of aspirants applied for various Govt. examinations in 2016.
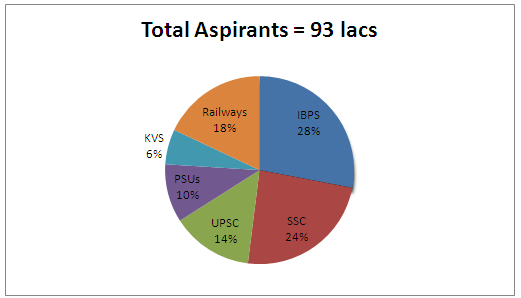
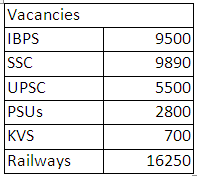
Q6. Average number of aspirants applied for a Govt. exam is approximately how many times the total no. of vacancies?
(a) 39
(b) 32
(c) 35
(d) 38
(e) 41
Q7. If Railways reduces two-fifth of its vacancies, then total vacancies will be reduced by how much percent?
(a) 13.56%
(b) 14.56%
(c) 18.2%
(d) 17%
(e) None of these
Q8. What will be the approximate difference between no of aspirant per post in SSC to the no of aspirant per post in IBPS?
(a) 50
(b) 41
(c) 45
(d) 52
(e) 48
Q9. For each vacancy, 4 will be selected for interview after written exam and one will be finally selected. If no. of vacancies of IBPS increased by 10%. No of aspirant qualified for Interview for IBPS is approximately how many times the no of aspirant qualified for interview in PSUs and KVS together.
(a) 3
(b) 3.5
(c) 5
(d) 4.5
(e) 2
Q10. Out of all vacancies allocated, 15% of the selected aspirants didn’t join. Hence 8% of the IBPS and 10% of Railways vacancies remain unfulfilled. What is approximate percent of total vacancies remain unfulfilled for IBPS and Railways to the rest of the organisations vacancy which remain unfulfilled.?
(a) 33
(b) 44
(c) 55
(d) 50
(e) 60
Directions (Q.11-15): Study the following table and bar graph to answer the questions given below it.
Percentage of appeared and qualified candidates in a competitive examination from different institutes
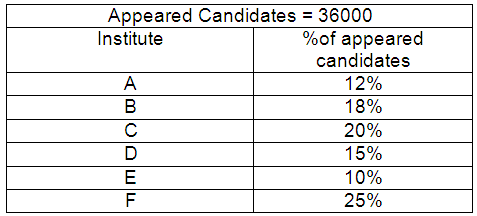
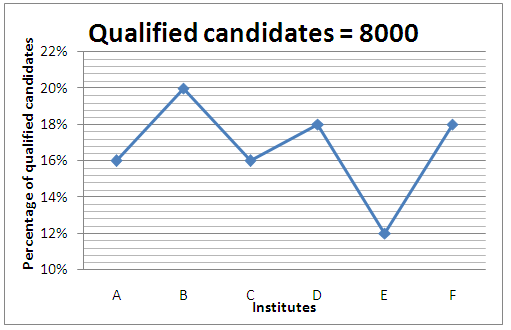
Q11. What is the ratio of the qualified candidates from institutes A, B and C together to the appeared candidates from institutes D, E and F?
(a) 52 : 225
(b) 26 : 125
(c) 125 : 26
(d) 13 : 200
(e) None of these
Q12. What per cent of the candidates from institute ‘E’ has been declared qualified out of the total candidates appeared from this institute?
(a) 16%
(b) 26%
(c) 16.66%
(d) 18%
(e) None of these
Q13. What is the approximate percentage of students qualified w.r.t. to those appeared from the institutes B and C together?
(a) 20
(b) 21
(c) 22
(d) 23
(e) 24
Q14. Which institute has the highest percentage of candidates qualified w.r.t. to those appeared?
(a) A
(b) B
(c) C
(d) D
(e) None of these
Q15. What is the average number of appeared candidates from the institutes A, B and F together?
(a) 19800
(b) 2200
(c) 6600
(d) 8600
(e) None of these
 SBI PO Salary 2023, Revised Salary Struc...
 SBI PO Interview and Psychometric Test A...
 SBI PO Study Plan 2023, Prelims Preparat...


