Dear Students,
-Quiz-for-IBPS-RRB-and-IBPS-PO-2017")
Data Interpretation Questions for IBPS Exam
Today we have been including some Tabular Data Interpretation Questions. This is the Data Interpretation Questions and you should try to do it within 20-21 Minutes. If you fail to complete it in stipulated time, then try again with full force. These Tabular Data Interpretation Questions are very important from exam point of view like IBPS RRB Exam, IBPS PO and IBPS Clerk.
Directions (Q1 – 5): The table given below shows the monthly salary of six employees working in a leading manufacturing firm.
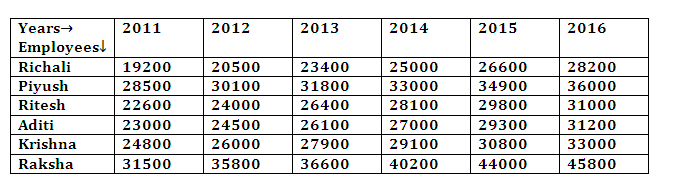
Q1. What is the difference between average monthly income of Aditi all over the years and monthly income of Raksha in 2015?
(a) Rs. 17250
(b) Rs. 18150
(c) Rs. 17510
(d) Rs. 17150
(e) None of these
Q2. Monthly salary of Ritesh in 2016 contributes for what percent in total monthly salary of Richali, Piyush and Krishna together in 2016? (approximately)
(a) 30%
(b) 32%
(c) 38%
(d) 42%
(e) 28%
Q3. Find the ratio of annual salary of Aditi in 2012 and Raksha in 2014 together to that of Piyush in 2013 and Richali in 2011 together?
(a) 6 :7
(b) 7 : 6
(c) 5 : 4
(d) 3 : 2
(e) None of these
Q4. Monthly salary of Piyush and Krishna together in 2013 is by what percent more or less than that of Aditi and Raksha together in 2015? (approximately)
(a) 19% more
(b) 16% less
(c) 19% less
(d) 16% more
(e) 29% less
Q5. In 2015, Raksha donated 5% of her monthly salary, she then lent out 20% of remaining salary on CI at 5% for 3 years. Find the interest (approx.) earned by her after 3 years?
(a) Rs. 1381
(b) Rs. 1318
(c) Rs. 1418
(d) Rs. 1315
(e) Rs. 1300
Directions (Q6 to 10): A team of 5 players participated in a tournament and played four matches (1 to 4). The following table gives partial information about their individual scores and the total runs scored by the team in each match.
Each column has two values missing. These are the runs scored by the two lowest scorers in that match. None of the two missing values is more than 10% of the total runs scored in that match.
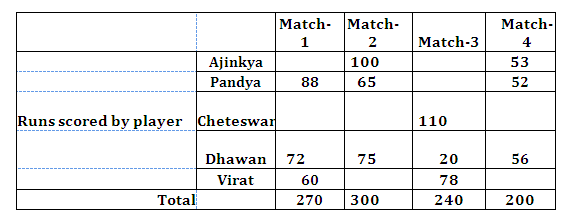
Q6. What is the maximum possible percentage contribution of Ajinkya in the total runs scored in the four matches (approximately)?
(a) 20%
(b) 22%
(c) 17%
(d) 23%
(e) Cannot be determined
Q7. What is the maximum possible percentage contribution of Virat in the total runs scored in the four matches?
(a) 18%
(b) 19.9%
(c) 18.6%
(d) 20.2%
(e) Cannot be determined
Q8. If the absolute difference between the total runs scored by Ajinkya and Cheteshwar in the Four matches is minimum possible then what is the ratio of Ajinkya and Cheteshwar’s total runs scored by them in the four matches.
(a) 187:189
(b) 189:187
(c) 183:187
(d) 189:188
(e) Cannot be determined
Q9.If the absolute difference between the total runs scored by Ajinkya and Cheteshwar in the four matches is minimum possible then what is the absolute difference between total runs scored by Pandya and Virat in the four matches?
(a) 32
(b) 37
(c) 35
(d) 27
(e) Cannot be determined
Q10. The players are ranked 1 to 5 on the basis of the total runs scored by them in the four matches, with the highest scorer getting Rank 1. If it is known that no two players scored the same number of total runs, how many players are there whose ranks can be exactly determined?
(a) 0
(b) 1
(c) 3
(d) 5
(e) Cannot be determined
Directions (Q11-15): The table below shows production of five types of Trucks by a company in the years 2009 to 2014. Study the table and answer questions.
Production of trucks by a company
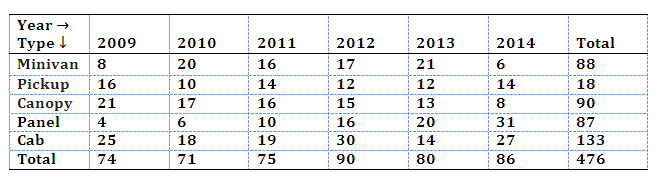
Q11. In which year the production of trucks of all types taken together was approximately equal to the average of the total production during the period?
(a) 2009
(b) 2011
(c) 2013
(d) 2014
(e) None of these
Q12. In which year, the total production of trucks of types of Minivan and Pickup together was equal to the total production of trucks of types Canopy and Panel together.
(a) 2010
(b) 2011
(c) 2014
(d) 2013
(e) None of these
Q13. During the period 2009-14, in which type of trucks was a continuous increase in production?
(a) Minivan
(b) Pickup
(c) Canopy
(d) Panel
(e) None of these
Q14. The production of which type of trucks was 25% of the total production of all types of trucks during 2013?
(a)Panel
(b) Canopy
(c) Pickup
(d)Minivan
(e) None of these
Q15. The per cent increase in total production of all types of trucks in 2012 to that in 2011 was?
(a) 15
(b) 20
(c) 25
(d) 30
(e) None of these


 Data Interpretation Questions for IBPS R...
 Data Interpretation Questions For Bank E...
 Data Interpretation Questions for SBI PO...