
Data Interpretation is one of the most crucial and frequently asked sections in all major bank exams, including IBPS RRB, SBI PO and Clerk, IBPS PO and Clerk, LIC, RBI Assistant, and RBI Grade B. It tests a candidate’s ability to analyze and interpret data accurately within a limited time. The questions are presented in various formats such as bar graphs, pie charts, tables, and line graphs, requiring strong calculation skills and logical reasoning. Practicing Data Interpretation questions regularly is essential for improving speed and accuracy, and the questions provided below are designed to help you strengthen this important area for your upcoming bank exams.
Data Interpretation Questions For Bank Exams
To help you do well in this section, we have given some Data Interpretation questions below. These questions are similar to the ones asked in real bank exams. They are made to help you understand different types of data formats and improve your calculation speed. Practice them to get better at solving such questions in less time and score more marks in the exam.
Direction (1-5): Read the following pie chart carefully and answer the questions given below. The following pie chart shows the distribution of four different types (Education, Rent, Transport and Others) of monthly expenditures and savings of Ravi.
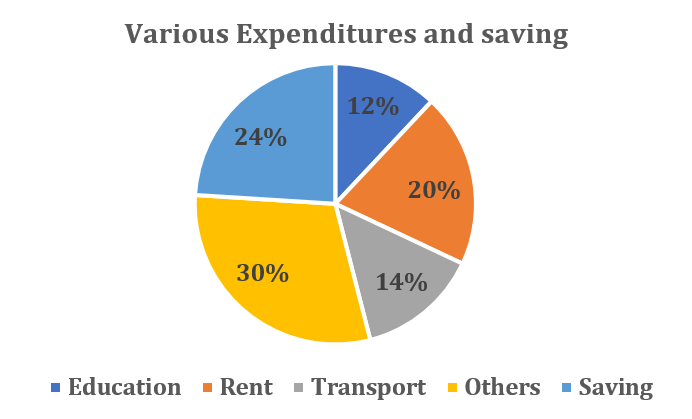
Q1. If amount spend by Ravi on Rent is Rs.12000, then find the monthly income of Ravi? (in Rs.)
(a) 60000
(b) 48000
(c) 72000
(d) 54000
(e) 84000
Q2. If Ravi’s monthly income is Rs.30,000, then find the average amount spend on Education, Rent and Transport together? (in Rs.)
(a) 4200
(b) 6500
(c) 5300
(d) 4600
(e) 5800
Q3. What is the central angle made by amount spent on Others? (in degrees)
(a) 96
(b) 120
(c) 108
(d) 84
(e) 72
Q4. If Ravi lends 45% of saving to his friend, which is Rs.1260, then find the amount spend on Education by Ravi? (in Rs.)
(a) 1250
(b) 1650
(c) 2100
(d) 1800
(e) 1400
Q5. If the difference between the amount spent on Transport and Education is Rs. 800, Then find the annual income of Ravi? (in Rs.)
(a) 600000
(b) 480000
(c) 720000
(d) 360000
(e) 240000
Direction (6-10): Read the following line chart carefully and answer the questions given below. The following line chart shows the percentage break up of number of students studying in different classes from 6 to 10 of school X in 2012.
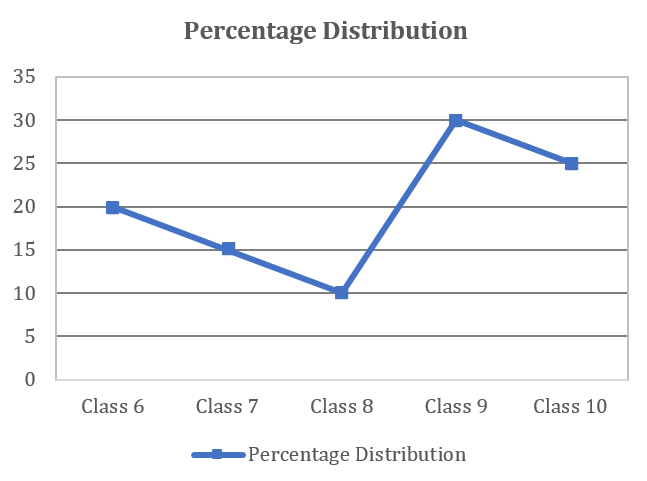
Note: Total students from class 6 to 10 are 400.
Q6. Find the number of students studying in classes 7 & 8 together is what percent more/less than the number of students studying in class 6?
(a) 50%
(b) 40%
(c) 30%
(d) 20%
(e) 25%
Q7. If the ratio of girls to boys in class 10 is 3:2 and the number of girls in class 6 is 35, then find the total number of boys studying in class 6 & 10 together?
(a) 85
(b) 100
(c) 65
(d) 70
(e) 90
Q8. Find the difference between the total students studying in classes 8 & 9 together and classes 6 & 10 together?
(a) 60
(b) 20
(c) 80
(d) 50
(e) 40
Q9. The total number of boys in classes 7 and 9 together are while the total number of girls in these classes are 110, then find
(a) 700
(b) 900
(c) 1300
(d) 1600
(e) 1100
Q10. If total students studying in class 11 are 30% more than the average number of students studying in classes 7 & 8 together, find the number of students studying in class 11?
(a) 75
(b) 35
(c) 45
(d) 65
(e) 85
Direction (11-15): Read the following table carefully and answer the questions given below. The following table shows the number of days taken by five different persons, A, B, C, D and E, and the percentage of work done in that particular time period.
Note: The work allotted to each person is same.
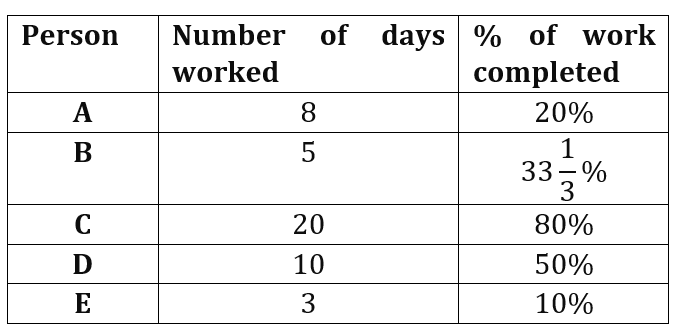
Q11. Find the number of days taken by C and B together to complete the whole work together? (in days)
(a) 9 3/8
(b) 8 1/3
(c) 10 1/8
(d) 7 3/4
(e) 6 1/3
Q12. Find the number of days taken by E is what percent more/less than the number of days taken by A to complete the work?
(a) 45%
(b) 30%
(c) 20%
(d) 50%
(e) 25%
Q13. Find the difference between the number of days taken by A & D together and D & E together to complete the work? (in days)
(a) 1/3
(b) 4/3
(c) 2/3
(d) 1/4
(e) 3/4
Q14. If D and E started the work together and after 5 days D left the work, so find the number of days required by E to finish the remaining work? (in days)
(a) 20.5
(b) 15.5
(c) 18.5
(d) 17.5
(e) 12.5
Q15. Find the number of days taken by A, D and C together to complete the work? (in days)
(a) 140/11
(b) 170/9
(c) 200/23
(d) 180/19
(e) 230/31
Directions (16-20):- Given pie graph shows percentage distribution of watches manufactured by a company in 2018. Study the graph carefully & answer the questions.
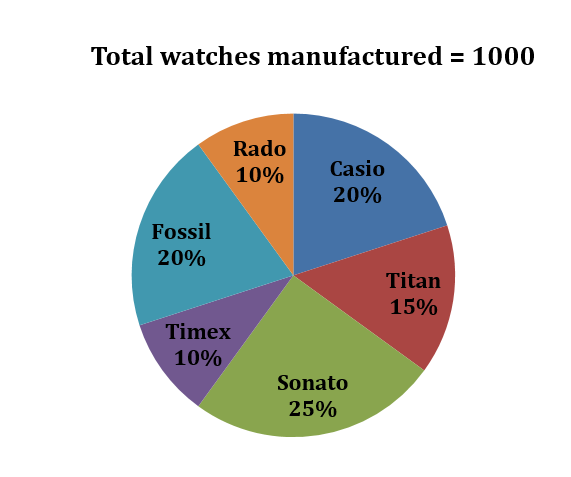
Q16. What is average of watches manufactured by Casio, Titan & Sonata together?
(a) 500
(b) 600
(c) 400
(d) 200
(e) 300
Q17. What is ratio of watches manufactured by Timex & Sonata together to that by Fossil & Casio together?
(a) 5:4
(b) 8:7
(c) 7:8
(d) 7:4
(e) 5:8
Q18. Watches manufactured of Sonata are what percent more/less than watches manufactured of Rado?
(a) 130%
(b) 150%
(c) 200%
(d) 170%
(e) 100%
Q19. If next year, Titan watch production increases by 10% while that of Timex decreases by 10%. What is difference in manufacturing of both in next year?
(a) 80
(b) 90
(c) 100
(d) 65
(e) 75
Q20. No. of watches manufactured of how many brands is more than average no. of watches manufactured?
(a) 4
(b) 3
(c) 1
(d) 2
(e) 5
Direction (21-25) : Line graph given below shows the selling prices (in rupees) of three types of Refrigerators (A, B & C) in four different years i.e. 2016, 2017, 2018, and 2019 for a shopkeeper
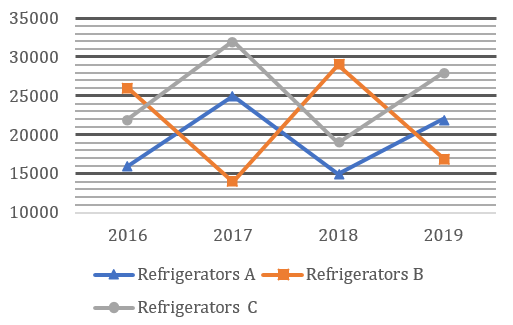
Q21. If a discount of 24% is given on refrigerator C sold in 2018 and ratio of MP to CP of C in 2018 is 5 : 3. then find the difference between the discount allowed and profit earned on C in 2018. (in rupees)
(a) 5000
(b) 4000
(c) 2000
(d) 6000
(e) 3000
Q22. Find out average selling price of refrigerator A in all the given years. (in rupees)
(a) 16500
(b) 22500
(c) 18500
(d) 19500
(e) 25500
Q23. Find out the ratio between selling price of refrigerator C in 2018 and the selling price of refrigerator A in 2017?
(a) 20:21
(b) 18:25
(c) 19:25
(d) 23:27
(e) 16:25
Q24. In which year sum of selling price of all 3 type of the refrigerator was the lowest?
(a) 2019
(b) 2016
(c) 2017
(d) 2018
(e) 2016 and 2018
Q25. selling price of refrigerator A in year 2018 is approx. what percent of selling price of refrigerator B in 2019?
(a) 78%
(b) 88%
(c) 82%
(d) 72%
(e) 93%
Directions (26-30):- Following Table chart gives the details of 5 students of a particular school in five different subjects in the annual exam.
| Maths (150) | Physics (150) | Chemistry (150) | English
(100) |
Computer (100) | |
| Amit | 70 | 66 | 58 | 54 | 80 |
| Aakash | 50 | 64 | 78 | 65 | 75 |
| Siddharth | 48 | 72 | 88 | 70 | 86 |
| Lokesh | 80 | 76 | 84 | 75 | 85 |
| Ritesh | 76 | 82 | 64 | 72 | 94 |
Note:- The data provided in the table is percentage of marks out of total marks in that particular subject.
Q26. Total marks scored by lokesh in physics, chemistry and maths together is how much more/less than total marks scored by Amit in the same three subjects together?
(a) 75
(b) 65
(c) 69
(d) 55
(e) 80
Q27 Find the overall percentage of marks scored by Siddharth in the exam?
(a) 75%
(b) 82%
(c) 68%
(d) 72%
(e) 80%
Q28. Find the difference of total marks scored by Ritesh in all the given subject together and total marks scored by Aakash in all the given subjects together?
(a) 71
(b) 84
(c) 78
(d) 82
(e) 93
Q29. Find the average marks scored in physics subject by all the given five students together?
(a) 105
(b) 110
(c) 108
(d) 100
(e) 98
Q30. Total marks scored by Aakash, Siddharth and Lokesh in English is what percentage of the total marks scored by Amit, Aakash and lokesh in maths?
(a) 75%
(b) 70%
(c) 65%
(d) 68%
(e) 80%
| Solutions | ||||
| 1. a | 2. d | 3. c | 4. e | 5. b |
| 6. e | 7. a | 8. b | 9. c | 10. d |
| 11. a | 12. e | 13. b | 14. d | 15. c |
| 16. d | 17. c | 18. b | 19. e | 20. b |
| 21. c | 22. d | 23. c | 24. d | 25. b |
| 26. c | 27. d | 28. a | 29. c | 30. b |

| Related Posts | |
| IBPS RRB PO Syllabus | IBPS RRB Clerk Syllabus |
| RBI Grade B Syllabus | SBI PO Syllabus |


 SBI PO Quantitative Aptitude 2026, Impor...
 Simple Interest Questions for Bank Exams
 Probability Questions for Bank Exams


