
Dear Readers,

It is time to pace up your preparation with New Pattern Questions of Quantitative Aptitude for SBI PO Prelims and NIACL Assistant 2017. These Quant questions will also help you in preparing for BOB PO and NICL AO 2017 recruitment examination. So here we are with the most important questions of Data Interpretation Questions for SBI PO Mains Exam 2017.
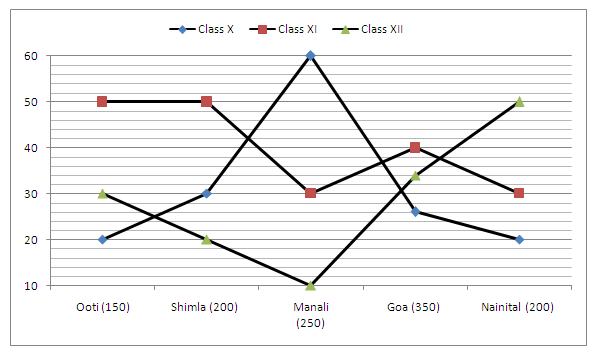
Directions (Q1- 5): Study the bar graph given below and answer the following questions:
The bar graph below shows the percentage break-up of the number of students who visited various tourist spots on New Year Evening.
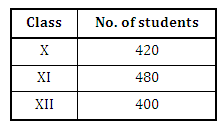
The table below shows the total number of students in classes X, XI and XII.
Note: No Student went to more than one place.
Q1. If the ratio of girls and boys, who went to Manali from class X, was 7 : 8, then what percent of the total number of students from class X who went to a tourist spot is the number of girls who went to Manali? (approximate)
(a) 19%
(b) 23%
(c) 25%
(d) 15%
(e) 21%
Q2. What is the difference between the number of students who did not got to any tourist spotfrom class XI and that from class XII?
(a) 19
(b) 41
(c) 27
(d) 21
(e) None of these
Q3. If all the students from class XII who did not go to any tourist spot, later changed their mind and went to Nainital, then calculate the % mark-up in the number of students who visited Nainital?
(a) 30%
(b) 25.5%
(c) 35.5%
(d) 42.6%
(e) None of these
Q4. The number of students from class XI and XII together who visited Manali is what percent of the number of students from class X who visited Shimla, Ooty and Nainital together? (approximate)
(a) 81%
(b) 72%
(c) 75%
(d) 77%
(e) 70%
Q5. Find the total number of students who didn’t visit any tourist spot?
(a) 152
(b) 165
(c) 105
(d) 150
(e) None of these
Directions (Q6-10): The following information is about the production of cars by 3 different companies from Monday to Friday in a specific week. Read the information carefully and answer the following question:–
The total production by 3 companies on Monday was 540 out of which 100/3% cars were produced by Tata. The number of cars produced by Renault on Monday is less than the cars produced by Tata on Monday by the same extent as the number of cars produced by Maruti on Monday is more than the cars produced by Tata on Monday. The difference between cars produced by Renault and Maruti on Monday is 40.
150 cars are produced by Tata on Tuesday, which is 100 less than the cars produced by the same company on Wednesday. A total of 910 cars were produced by Tata from Monday to Friday. The ratio between cars produced by Tata on Thursday to cars produced by the same company on Friday is 5 : 6.
220 cars were produced by Renault on Tuesday, which is 80 less than the cars produced by Maruti on Wednesday. A total of 570 cars were produced on Tuesday, which is 76% of the total cars produced on Wednesday. The number of cars produced by Maruti on Thursday is 200/3% more than cars produced by Tata on the same day. Total 580 cars were produced on Thursday. The number of cars produced by Maruti on Friday is same as that on Monday. 140 cars were produced by Renault on Friday.
Q6. Find the ratio between total cars produced on Monday to that on Wednesday.
(a) 18 : 29
(b) 18 : 25
(c) 18 : 31
(d) 3 : 5
(e) None of these
Q7. Find the total number of cars produced by Renault from Monday to Friday.
(a) 900
(b) 980
(c) 950
(d) 960
(e) None of these
Q8. Find the average number of cars produced per day by Maruti from Monday to Friday. (approximate)
(a) 250
(b) 220
(c) 270
(d) 240
(e) 230
Q9. On which pair of days out of the following, the number of cars produced by Tata is the same?
(a) Tuesday and Wednesday
(b) Wednesday and Thursday
(c) Tuesday and Thursday
(d) Monday and Wednesday
(e) Monday and Tuesday
Q10. On which day the total number of cars produced was the maximum?
(a) Monday
(b) Tuesday
(c) Wednesday
(d) Thursday
(e) Friday
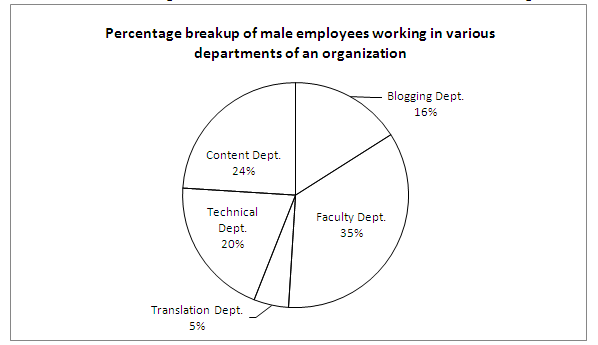
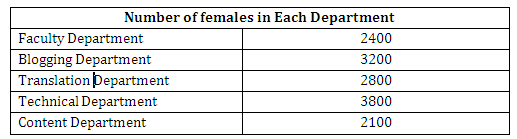
Directions (Q11-15): Study the following pie chart and answer the following question given below: –
Number of male in the organization is two times of the number of females in the organization
Q11. Number of males in Blogging, Technical and Content department together are approximately what percent more/less than the total number of females in the same departments?
(a) 85%
(b) 89%
(c) 94%
(d) 79%
(e) 95%
Q12. Out of the total number of employees from Translation department, 30% of the employees got promoted then find the ratio of the number of employees from Translation department who get promoted to the total number of male employees in the organization ?
(a) 28600 : 1269
(b) 1170 : 28779
(c) 1269 : 14300
(d) 1269 : 28600
(e) 28779 : 1170
Q13. If one male from Faculty can do a work in 20020 days and the female from Faculty are 20% less efficient than that of male in Faculty. Find the total no. of employees from Faculty to do the same job?

Q14. Find the difference between the average number of males in all departments of the organization and the average number of females in all departments of the organization?
(a) 2860
(b) 2440
(c) 2630
(d) 2920
(e) None of these
Q15. If some male employees from Content Department shifted to Blogging department and some female employees from Blogging departments shifted to Content departments such that total number of male employees and female employees in Content Department are same as total number of male employee and female employee in Blogging departments respectively. Now find the Average of the number of female employees from Content and male employee in Blogging department together?
(a) 4195
(b) 4185
(c) 4220
(d) 5210
(e) Can’t be determined


 CENTRAL BANK Of INDIA Apprentice Result ...
 SBI PO Salary 2026, Check New CTC, Perks...
 IBPS Clerk Selection Process 2026, Check...


