
 |
Following the study plan for SBI PO Preliminary Examination 2018, the first week starts with practice questions on Quadratic Equations, Tabular Graph DI, and More Questions Set. To ensure proper preparation of the section we advise you to go through all the questions sincerely and try to attempt each one of them. Afterward, match your solutions and the approach with the one that would be provided later. Practice more and more questions on the same section to enhance your grip over the topics. Following is the Quantitative Aptitude quiz to help you practice with the best of latest pattern questions.
(a) 4 seconds
(b) 5 seconds
(c) 6 seconds
(d) 8 seconds
(e) 10 seconds
Q7. There are total 30 students is in class ‘A’ and class ‘B’ together. Average marks of class ‘A’ is 30 while average marks of class ‘B’ is 36. If total marks of class ‘B’ is 80% more than that of class ‘A’ then find total number of student in class ‘B’?
(a) 12
(b) 15
(c) 9
(d) 21
(e) 18
Q8. Average of five consecutive odd numbers is D. If the next five odd numbers are also included, then the average:
(a) remains unchanged
(b) Increases by 2
(c) Increases by 3
(d) Increases by 4
(e) Increases by 5
Q9. Aman have certain amount with himself. He invested half of amount in scheme ‘A’ which offers compound interest at the rate of 10% p.a. and remaining half in scheme ‘B’ which offers compound interest at the rate of 20% p.a. If after 2 years he earns total interest of Rs5200, then find the amount Aman has initially?
(a) 8,000
(b) 12,000
(c) 16,000
(d) 20,000
(e) 24,000
Q10. Satish invested Rs 4000 each in two schemes which offers same rate of interest but one at simple interest and other at compound interest. If difference between interest earned from these schemes after 2 years is Rs 360 then find the rate percentage?
(a) 10%
(b) 15%
(c) 20%
(d) 25%
(e) 30%
Direction (11-15): – Table given below shows car manufactured by five different companies in six different years. Study the data carefully and answer the following questions–
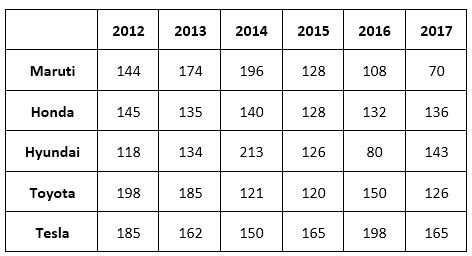
Q11. Find the ratio of cars manufactured by ‘Honda’ in 2014 and 2015 together to cars manufactured by ‘Toyota’ in 2013 and 2016 together?
(a) 9 : 10
(b) 3 : 4
(c) 4 : 5
(d) 14 : 15
(e) 7 : 8
Q12. Total cars manufactured by ‘Maruti’ in all six years together is what percent more/less than total cars manufactured by ‘Tesla’ in all six years together?
(a) 15%
(b) 20%
(c) 30%
(d) 10%
(e) 25%
Q13. Average number of cars manufactured in year 2014 by all five companies together is how much more than average number of cars manufactured in year 2013 by all five companies together.
(a) 2
(b) 4
(c) 6
(d) 8
(e) 10
Q14. In 2018, every car manufacture increased its production by 25%, then find total number of cars manufactured in 2018 by all five companies together.
(a) 720
(b) 800
(c) 840
(d) 880
(e) 960
Q15. Average number of cars manufactured by ‘Hyundai’ in 2012, 2015 and 2016 together is what percent of average number of cars manufactured by ‘Toyota’ in all six years together.
(a) 68%
(b) 64%
(c) 80%
(d) 76%
(e) 72%


 Quantitative Aptitude Quiz For SBI Clerk...
 Quantitative Aptitude Quiz For Bank Foun...
 Quantitative Aptitude Quiz For IBPS Cler...


