
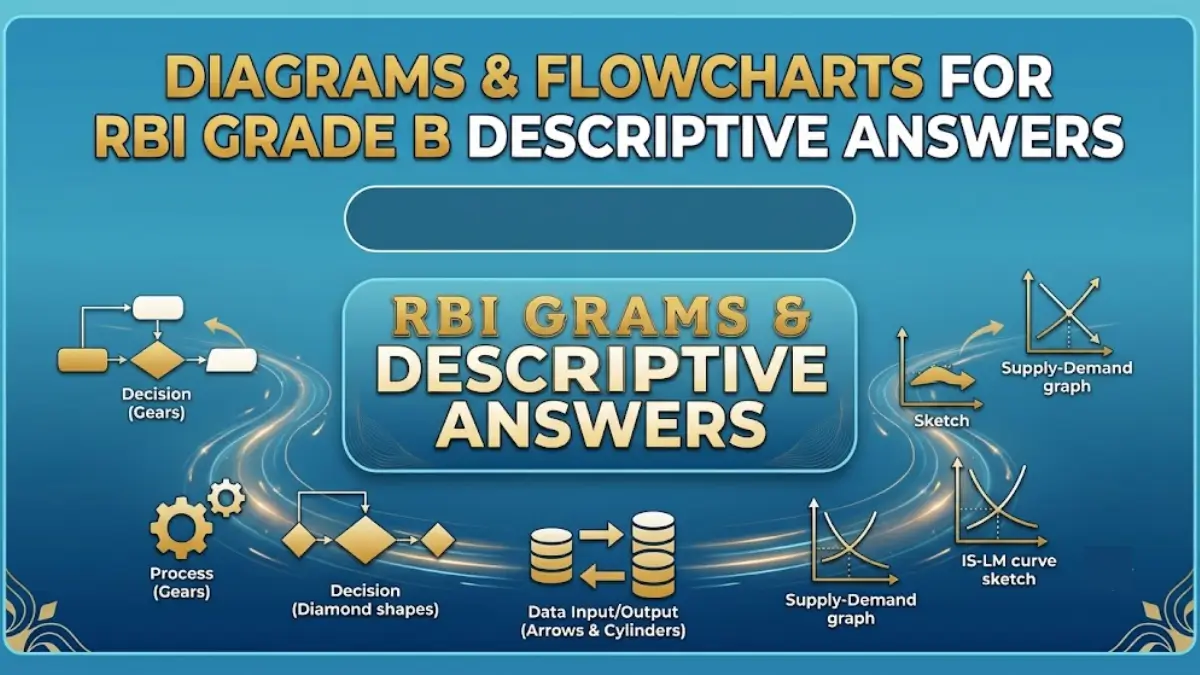
RBI Grade B Phase 2 descriptive papers require candidates to present their knowledge in a clear, structured, and analytical manner. Along with strong content, the presentation style of answers also plays an important role in creating a positive impression on the examiner. Here we present some important roles and tips that can help candidates improve their writing skills and use diagrams and flowcharts in their descriptive answers.
Role of Diagrams & Flowcharts in RBI Grade B Descriptive Answers
Using diagrams, flowcharts, and tables can help candidates explain complex concepts in a simple way, improve answer readability, and make their responses more organised. These visual tools are especially useful in Economic & Social Issues (ESI) and Finance & Management (FM) papers.
Why Presentation Matters in RBI Grade B Descriptive Papers?
In RBI Grade B Phase 2, many candidates write answers with similar concepts and information. The difference often comes from how effectively the answer is presented.
A well-structured answer should include:
- A clear introduction
- Logical explanation of concepts
- Relevant facts, examples, and data
- Proper conclusion
- Visual representation wherever required
Importance of Diagrams in RBI Grade B Answers
Diagrams and flowcharts help the examiner quickly understand the key points and improve the overall presentation of the answer.
1. Simplifies Complex Concepts
Many RBI Grade B topics involve multiple factors and relationships. Explaining everything through paragraphs can make answers lengthy.
- For example, inflation can be explained through a simple flow:
- Higher Demand → Increased Consumption → Price Rise → Inflation
- This makes the concept easier to understand and saves writing time.
2. Improves Answer Structure
A page filled with continuous paragraphs can look difficult to read. Adding relevant diagrams or flowcharts creates better organisation and highlights important points.
Visual representation helps in:
- Improving readability
- Presenting ideas systematically
- Showing analytical understanding
3. Helps in Time Management
RBI Grade B Phase 2 papers have limited time. Flowcharts allow candidates to present multiple points in a concise manner without compromising clarity.
- For example, monetary policy transmission can be represented as:
- RBI Policy Rate Change → Bank Lending Rates → Borrowing & Investment → Economic Growth
Types of Diagrams Useful for RBI Grade B Answers
Diagrams and flowcharts can significantly improve the quality of RBI Grade B descriptive answers by making them more structured, clear, and examiner-friendly.
1. Cause and Effect Flowcharts
These are useful for explaining reasons and outcomes of economic and social issues.
Example:
- Low Skill Development → Limited Job Opportunities → Unemployment → Lower Income Growth
- Topics like poverty, unemployment, inflation, and financial inclusion can be explained effectively using this format.
2. Process Flowcharts
Process flowcharts are helpful for explaining step-by-step mechanisms.
Examples:
- Monetary policy transmission
- Risk management process
- Financial inclusion framework
- Banking procedures
3. Comparison Tables
Tables are useful when questions require differences between two concepts.
Examples:
- Fiscal Policy vs Monetary Policy
- Inflation vs Deflation
- Banks vs NBFCs
- Direct Tax vs Indirect Tax
Use of Diagrams in ESI and FM Papers
ESI topics often involve social and economic relationships where diagrams can improve explanation.
Diagrams in ESI
Useful areas include:
- Poverty cycle
- Financial inclusion
- Sustainable development
- Demographic dividend
- Government schemes
- Inclusive growth
- Diagrams in FM
FM topics also provide opportunities for using frameworks and flowcharts.
Useful topics include:
- Risk management
- Corporate governance
- Banking structure
- Basel norms
- Leadership theories
- Financial markets
Common Mistakes While Using Diagrams
Although diagrams improve presentation, incorrect usage can reduce answer quality. Candidates should avoid:
- Adding unnecessary diagrams in every answer
- Drawing complicated figures that waste time
- Using visuals without explanation
- Including incorrect information
- Ignoring the main question while focusing on presentation
- Diagrams should support the answer and not replace proper explanation.
Tips to Use Diagrams in RBI Grade B Answers
- Use diagrams only when they add value to the answer.
- Keep flowcharts simple and easy to understand.
- Add proper labels and arrows.
- Explain the diagram in 2–3 lines.
- Practice common diagrams during answer writing practice.









 RBI Grade B Eligibility 2027, Educationa...
 NICL Assistant Syllabus 2026, Check Exam...
 NICL Assistant Result 2026 Out, Download...