
The Economic Survey 2025-26, released in January 2026, presents a data-backed snapshot of India’s economic performance, fiscal position, and long-term growth capacity. The Survey places strong emphasis on numerical indicators to explain how India has sustained momentum despite global volatility and geopolitical disruptions. It highlights that macroeconomic stability, steady reforms, and public investment have translated into measurable outcomes across growth, fiscal consolidation, inflation management, and external resilience.
Economic Survey 2025-26
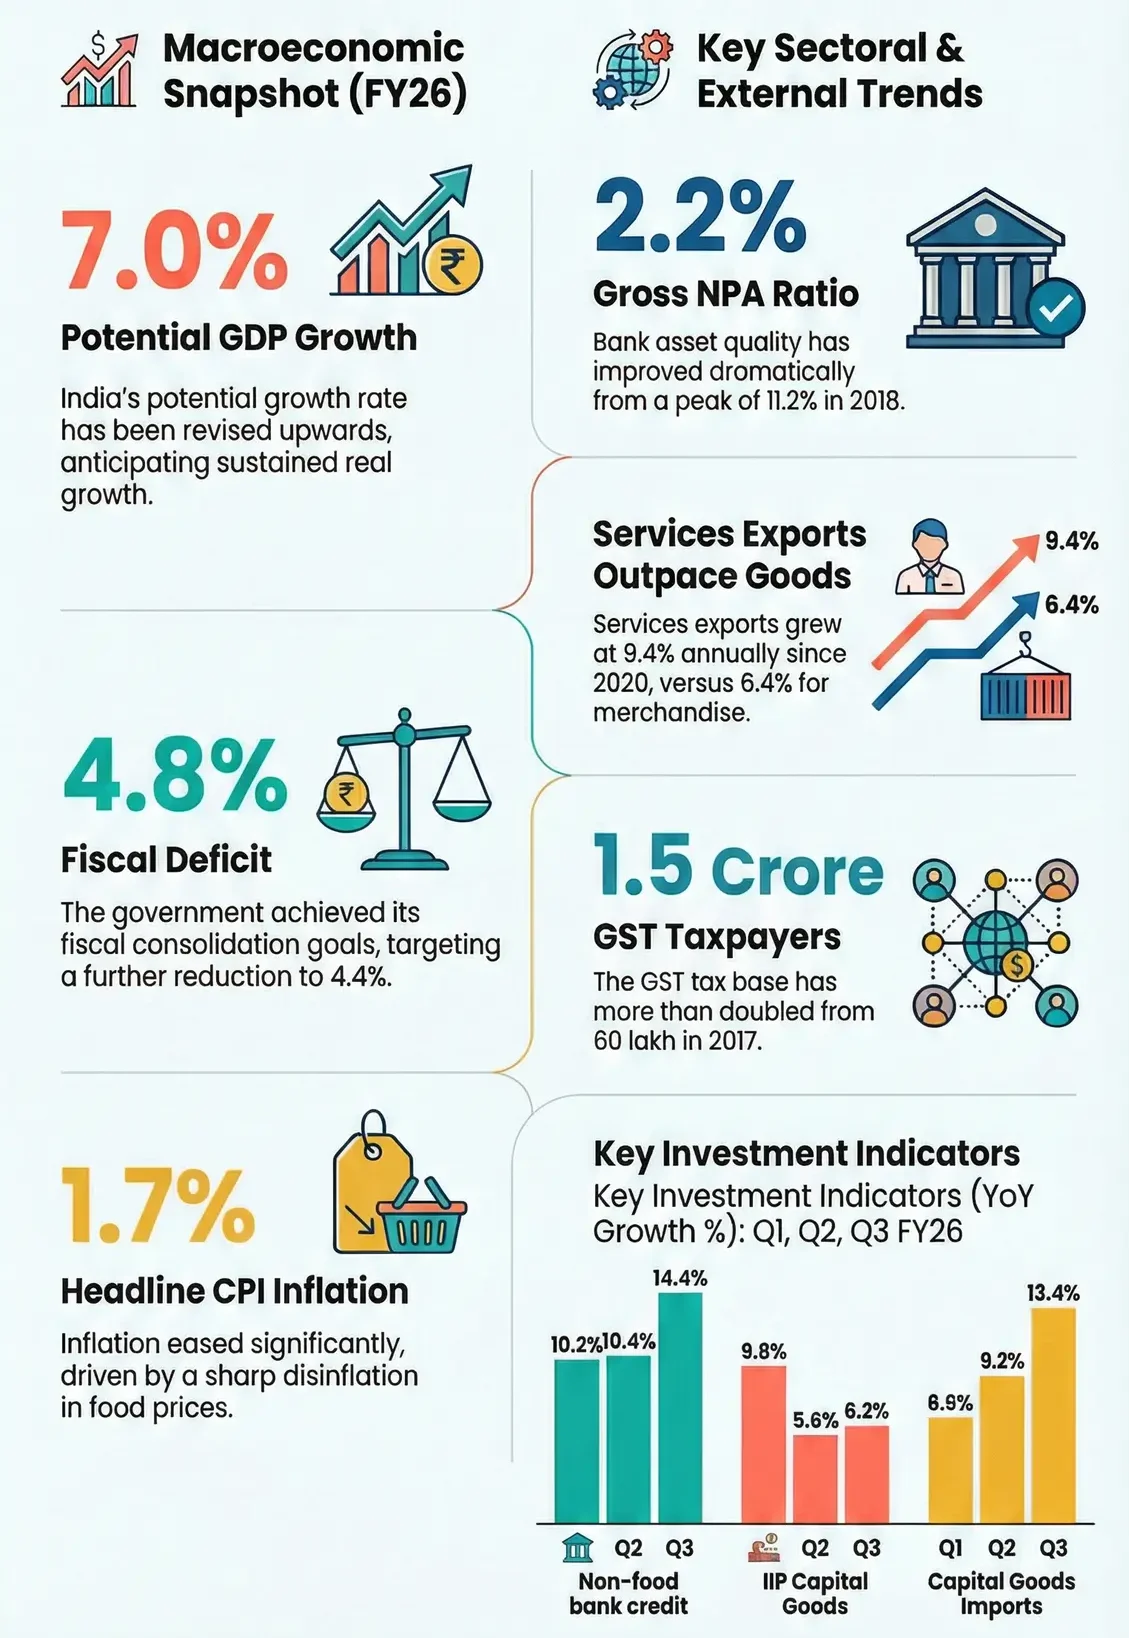
One of the most important quantitative conclusions of the Survey is the upward revision of India’s potential growth rate to 7.0%, from 6.5% estimated three years earlier. This revision is supported by sustained infrastructure creation, improved logistics efficiency, and rising productive capacity. The Survey also confirms that real GDP growth is expected to remain above 7%, extending into FY27, even as global trade and financial conditions remain uncertain.
Growth and Macroeconomic Indicators
The Survey uses high-frequency indicators and nowcasting models to support its growth projections. These indicators show consistency rather than episodic spikes.
- Potential GDP growth was revised upward to 7.0%.
- Real GDP growth expected to stay at or near 7% in FY26 and FY27.
- Domestic demand remains the primary growth driver.
- Core inflation trend indicates strengthening supply-side capacity.
Fiscal Numbers and Deficit Targets
Fiscal consolidation remains one of the strongest numerical signals in the Survey. The Centre has met or exceeded its announced targets.
- Union fiscal deficit achieved at 4.8% of GDP in FY25, against a budgeted 4.9%.
- Fiscal deficit target for FY26 set at 4.4% of GDP.
- Fiscal deficit reduced from 9.2% of GDP in FY21 to below 5% within four years.
- Capital expenditure is prioritised over revenue expenditure to support long-term growth.
Interest Rates, Cost of Capital, and Bond Yields
The Survey provides comparative data to explain why capital remains expensive in India despite stable inflation.
- India’s 10-year government bond yield: 6.7%.
- Indonesia’s 10-year government bond yield: 6.3%, despite similar BBB credit rating.
- Persistent current account deficits increase India’s risk premium.
- Structural external deficits keep long-term borrowing costs elevated.
External Sector and Trade Data
The numerical comparison between goods and services exports is a major highlight of the Survey.
- CAGR of total exports since 2020: 9.4%.
- CAGR of merchandise exports since 2020: 6.4%.
- Services exports continue to outperform goods exports.
- Services surplus and remittances are insufficient to fully offset the goods trade deficit.
Inflation and Price Stability
Inflation data indicate better anchoring compared to earlier cycles, though food prices remain volatile.
- Headline inflation remains contained.
- Core inflation (excluding gold and silver) shows a subdued trajectory.
- Food inflation remains the primary source of price volatility.
- Improved logistics and supply management have reduced inflation persistence.
Infrastructure Expansion: Quantitative Indicators
Infrastructure growth is presented as a measurable contributor to productivity improvement.
- The airport network has doubled over the last decade.
- Inland waterways freight movement has increased rapidly.
- Logistics efficiency gains are reducing economy-wide costs.
- Infrastructure investment continues to crowd in private investment.
Global Risk Indicators and External Environment
The Survey uses global indicators to highlight rising uncertainty.
- Gold prices rose from USD 2,607 per ounce to over USD 5,100 per ounce by January 2026.
- Probability assigned to a fragile but manageable global scenario: 40–45%.
- Probability of a disorderly multipolar breakdown: 40–45%.
- Probability of a systemic global shock cascade: 10–20%.
Strategic Capacity and Power Metrics
The Survey includes global comparative indicators to highlight India’s strategic position.
- India’s score on the Lowy Institute Power Gap Index: –4.0.
- Lowest power gap score in Asia, excluding Russia and North Korea.
- Indicates underutilisation of economic and strategic potential.


 Daily Current Affairs and GK Updates (3r...
 RBI Assistant Prelims Admit Card 2026 Ou...
 International Day for Mine Awareness 202...