
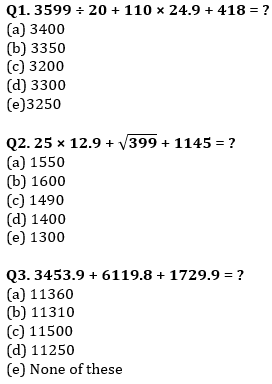
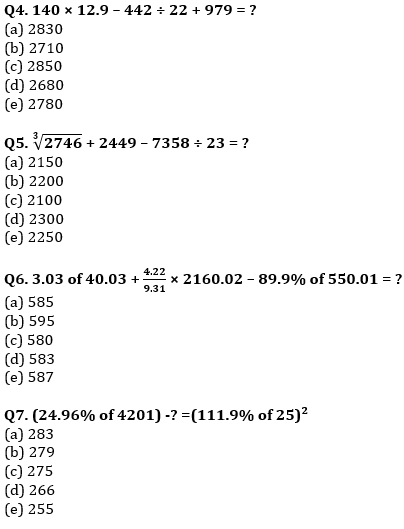
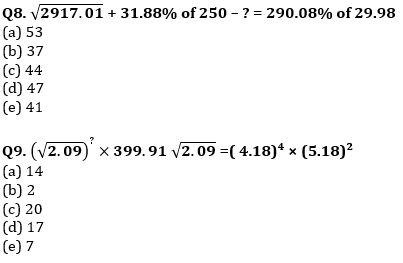
Directions (1-9): What approximate value should come in place of question mark (?) in following questions.
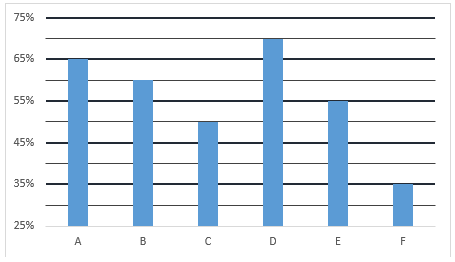
Directions (10-15): The pie chart given below shows the percentage distribution of population of 6 different villages in 2018 and bar graph shows the male percentage in each village in same year.
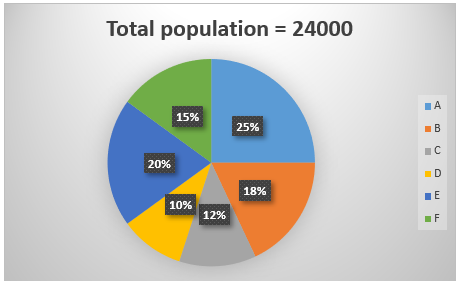
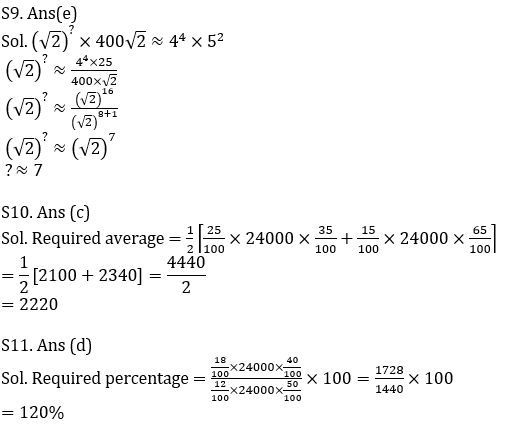
Q10. What is the average no. of females in village A and F?
(a) 2420
(b) 2530
(c) 2220
(d) 2280
(e) 2160
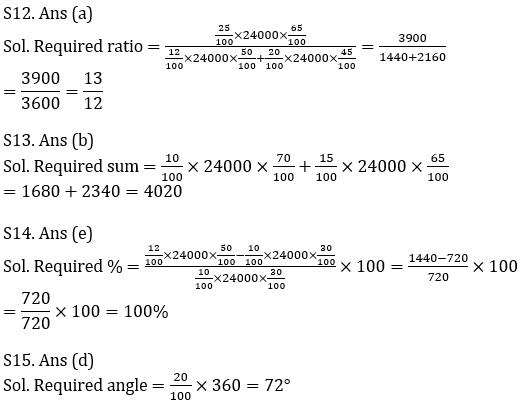
Q12. What is the ratio between male population of village A to female population of village C and E together?
(a) 13 :12
(b) 11 : 15
(c) 12 :13
(d) 9 :13
(e) 13 :11
Q13. What is the sum of male population in village D and female population in village F?
(a) 3040
(b) 4020
(c) 4220
(d) 3860
(e) 4120
Q14. Male population in village C is what percentage more/less than female population in village D?
(a) 66.67%
(b) 50%
(c) 125%
(d) 75%
(e) 100%
Q15. What is central angle corresponding to total population of village E?
(a) 60°
(b) 75°
(c) 90°
(d) 72°
(e) 108°
Solutions

Click Here to Register for Bank Exams 2021 Preparation Material


 Adda247 Classroom Experience Now Availab...
 SBI CBO Previous Year Question Papers Wi...
 IBPS Exam Date 2026 Out For Deputy Manag...