
Directions (1-5): The following pie chart shows the percentage distribution of candidates who were selected in Armed forces from six different district of ‘X’.
Study the graph carefully to answer the following questions.
Total selected candidates = 25,000
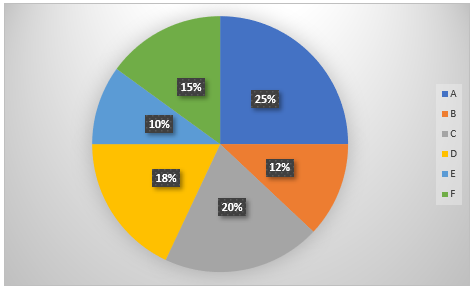
Q1. Find the difference between the number of candidates selected in Armed forces from F and C?
(a) 1650
(b)1400
(c) 1250
(d) 1500
(e) 1700
Q2. Find the average number of candidates who were selected in Armed forces from E, B and C?
(a) 3500
(b) 4500
(c) 2500
(d) 3000
(e) 4000
Q3. Find the total number of candidates selected from A is how much percent more than that from E?
(a) 50%
(b) 100%
(c) 200%
(d) 150%
(e) 250%
Q4. If the ratio of male to female out of selected candidates from D is 4:1, then find the total female candidates who are selected from D?
(a) 1200
(b) 900
(c) 750
(d) 600
(e) 800
Q5. Find the total number of candidates selected from B is what percent of that from F?
(a) 80%
(b) 50%
(c) 60%
(d) 120%
(e) 25%
Directions (6-10): Find the approximate value of question marks (?) in following questions?
Q6. 74.98% of 360.01-?% of 124.99=139.923
(a) 86
(b) 104
(c) 95
(d) 112
(e) 126
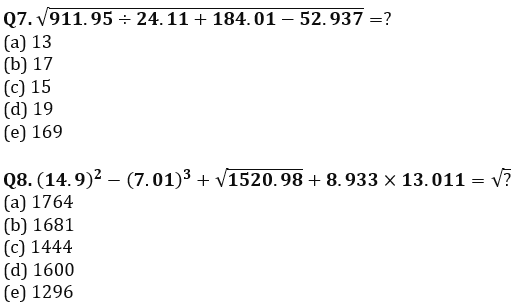
Q9. (1657.98-?)÷45.012=16.991
(a) 794
(b) 831
(c) 1031
(d) 743
(e) 893
Q10. (3416.023÷55.991)-(1133.96÷?)=39.989
(a) 13
(b) 27
(c) 23
(d) 54
(e) 34
Directions (11–15): What will come in the place of question (?) mark in the following number series.
Q11. 46, 71, 87, 96, 100, ?
(a) 128
(b) 125
(c) 116
(d) 101
(e) 111
Q12. 231, 253, 293, 369, ?, 809
(a) 507
(b) 517
(c) 515
(d) 516
(e) 519
Q13. 2620, 1308, 652, ?, 160, 78
(a) 324
(b) 456
(c) 388
(d) 412
(e) 290
Q14. 81, 96, 118, 149, 191, ?
(a) 255
(b) 213
(c) 246
(d) 230
(e) 266
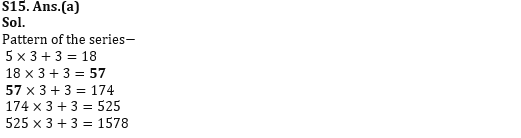
Q15. 5, 18, ?, 174, 525, 1578
(a) 57
(b) 77
(c) 64
(d) 44
(e) 38
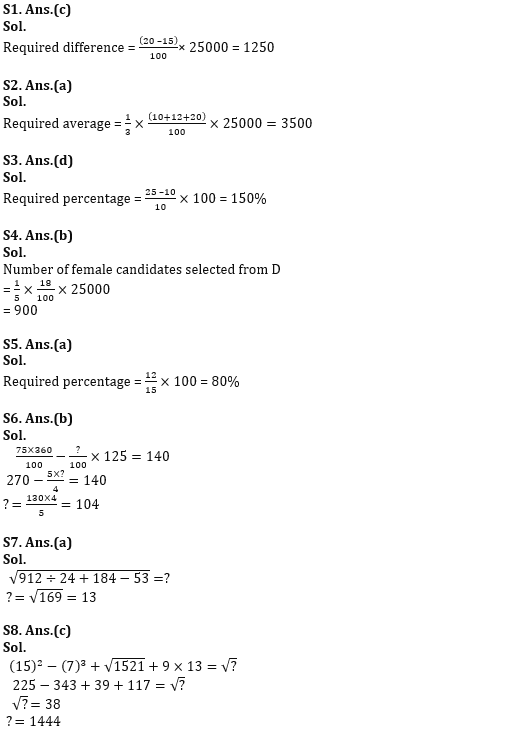
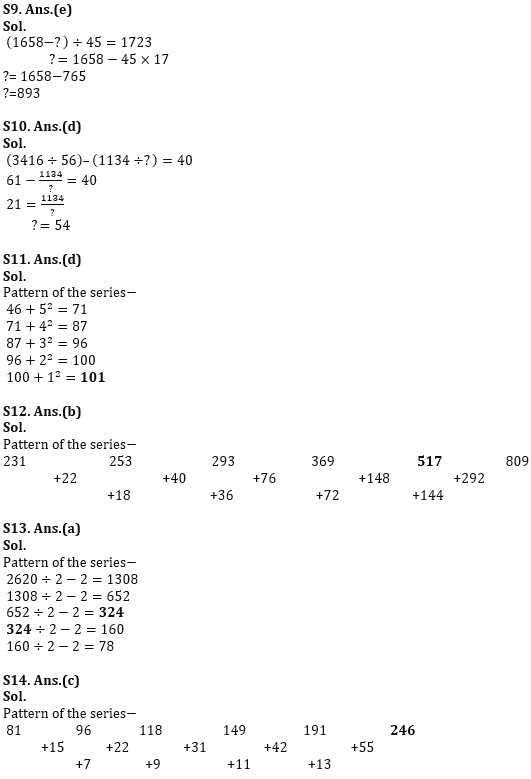
Solutions


 Daily Current Affairs and GK Updates (3r...
 RBI Assistant Prelims Admit Card 2026 Ou...
 International Day for Mine Awareness 202...