

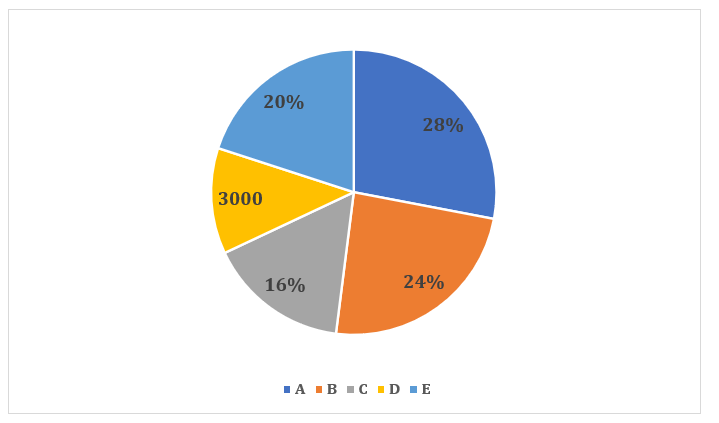
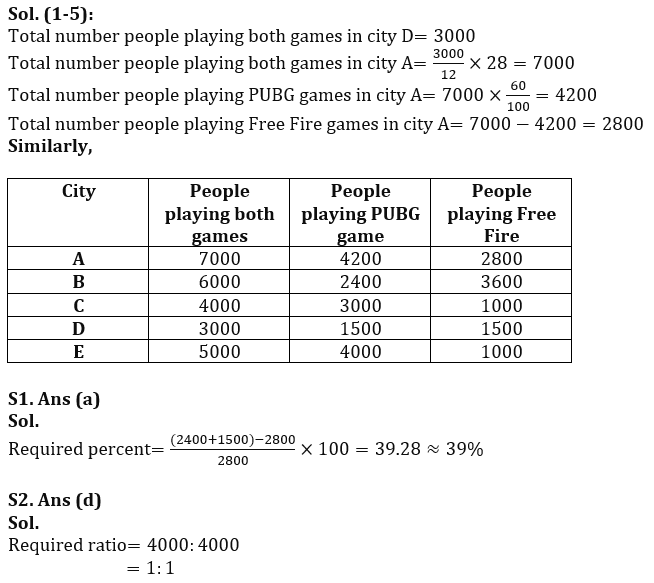
Directions (1-5): Read the following pie chart and line chart carefully and answer the questions given below.
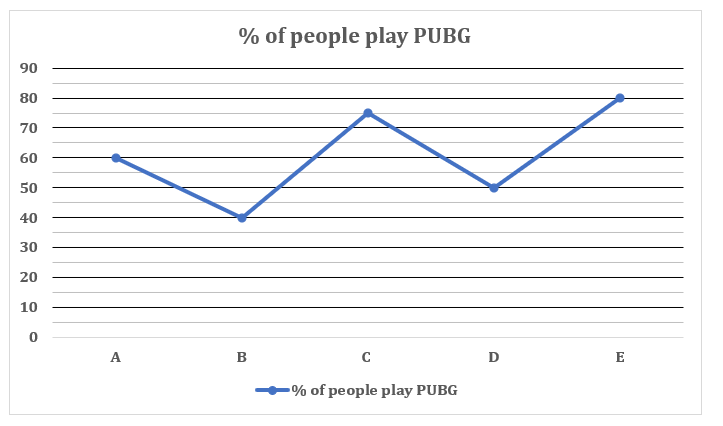
Pie chart shows percentage distribution of people who played two shooting games (PUBG + Free Fire) in five cities (A, B, C, D & E) and line chart shows percentage of no. of people who played PUBG in these five cities. Read the data carefully and answer the questions given below.
Note: One people plays only one shooting game.
Q1. Total number of people playing PUBG in cities B & D together is approximately what percent more/less than the number of people playing Free Fire in city A?
(a)39%
(b)44%
(c)51%
(d)33%
(e)25%
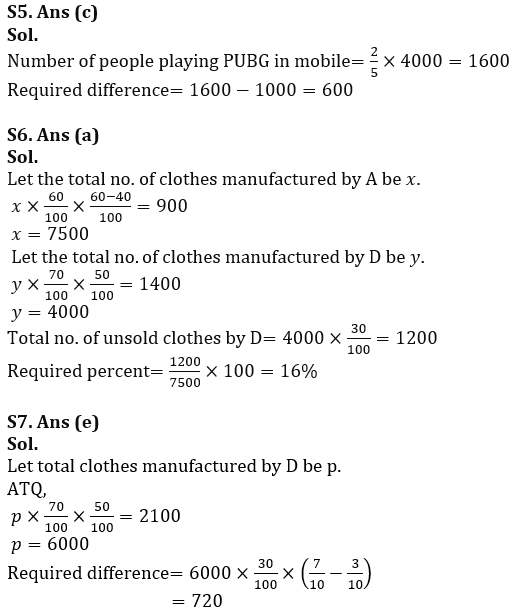
Q2. Find the respective ratio of number of people playing PUBG in city E to number of people playing both games in city C?
(a)2:3
(b)1:2
(c)1:3
(d)1:1
(e)2:1
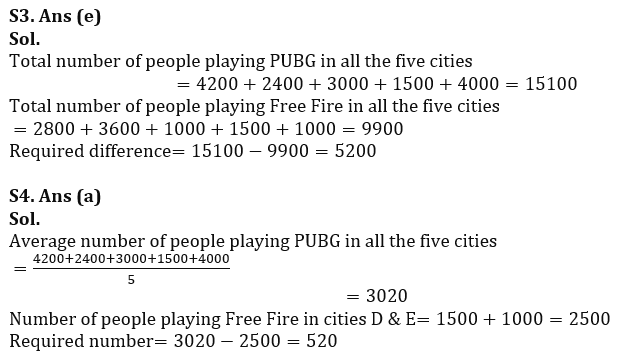
Q3. Find the difference between the total number of people playing PUBG in all the five cities together and to that of Free Fire?
(a)4000
(b)4400
(c)6600
(d)5800
(e)5200
Q4. Number of people playing Free Fire in cities D & E together are how more/less than the average number of people playing PUBG in all cities together?
(a)520
(b)600
(c)660
(d)460
(e)400
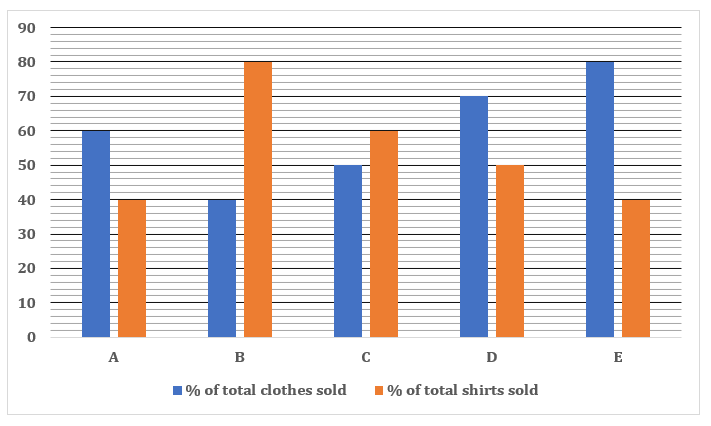
Directions (6-10): Read the following bar carefully and answer the questions given below.
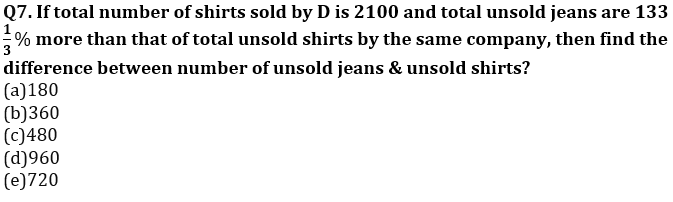
Bar graph given below shows total number of clothes sold out of total number of clothes manufactured by five different companies (A, B, C, D & E) and percentage of shirts sold out of total number of clothes sold by these five companies.
Note: Only two types of clothes are manufactured i.e. jeans and shirts.
Q6. If difference between total no. of shirts sold and total no. of jeans sold by A is 900 and total no. of shirts sold by D is 1400, then total no. of unsold clothes by D is what percent of total no. of clothes manufactured by A?
(a)16%
(b)20%
(c)40%
(d)30%
(e)24%
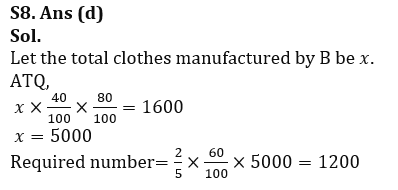
Q8. Ratio of unsold jeans to unsold shirts of B is 2:3 respectively. If total no. of shirts sold by B are 1600, then find the unsold no. of jeans.
(a)800
(b)2400
(c)2000
(d)1200
(e)1600
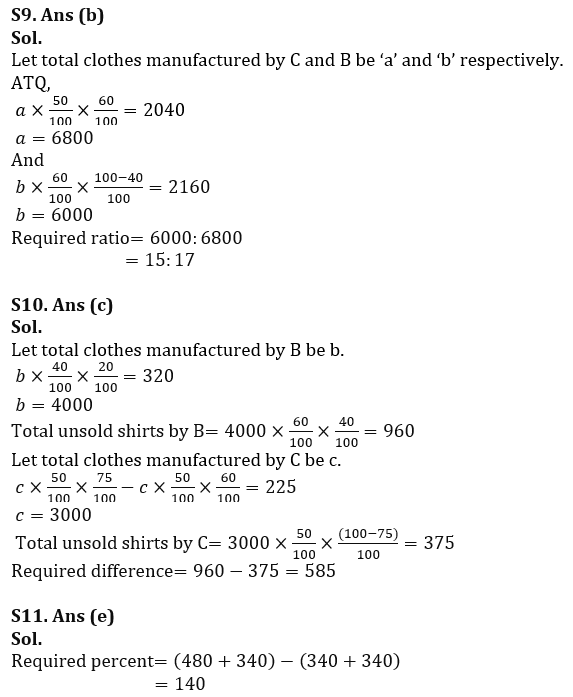
Q9. Total no. of Shirts sold by C is 2040 and total no. of unsold jeans of B is 2160. If total no. of unsold shirts of B are 60% less than of total no. of unsold clothes by B, then find the ratio of total no. of clothes manufacture by B to that of by C?
(a)17:15
(b)15:17
(c)18:13
(d)13:18
(e)17:18
Q10. Total no. of unsold jeans of B are 60% of total no. of unsold clothes by B. Total no. of jeans sold by B is 320 and total no. of unsold jeans of C is 225 more than total no. of shirts sold by same company. Moreover, total unsold jeans by C are 75% of total unsold clothes by same company, then find difference between total no. of unsold shirts by B & C?
(a)475
(b)615
(c)585
(d)635
(e)555
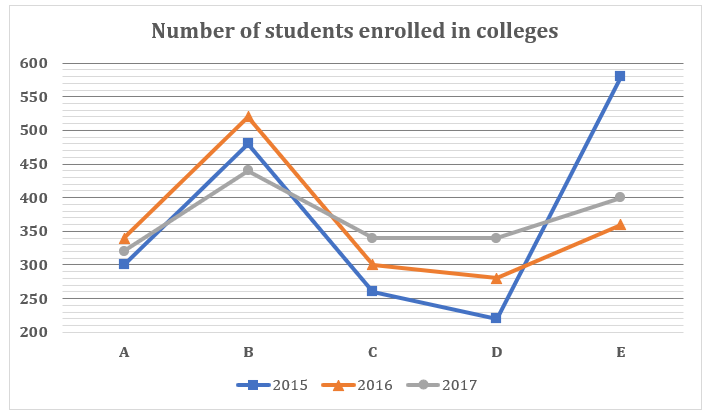
Directions (11-15): Read the following line graph carefully and answer the questions given below.
The following line graph shows the number of students enrolled in five different colleges (A, B, C, D & E) during three different years, 2015, 2016 & 2017. Read the data carefully and answer the questions.
Q11. Total number of students enrolled in A in 2016 and D in 2017 together is how much more/less than total number of students enrolled in B in 2015 and D in 2017 together?
(a)100
(b)240
(c)120
(d)200
(e)140
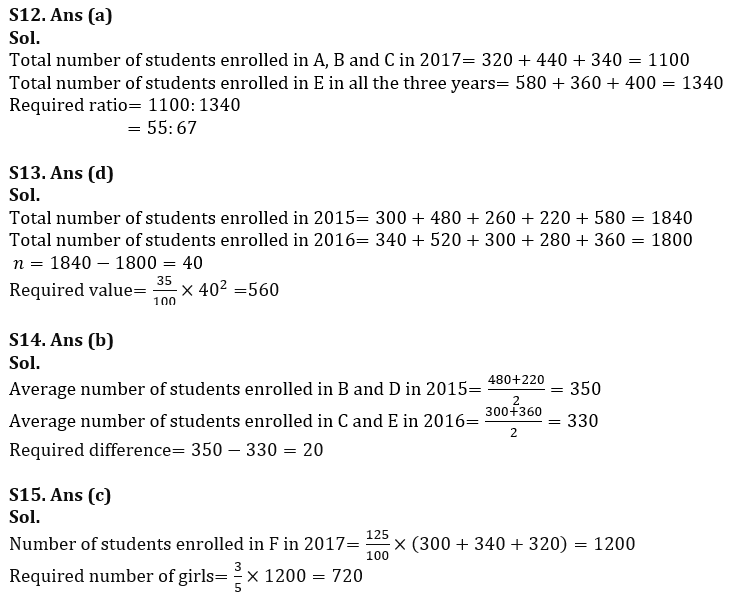
Q12. Find the respective ratio of total number of students enrolled in A, B and C in 2017 together to total number of students enrolled in E in all the given three years together?
(a)55:67
(b)51:89
(c)67:55
(d)89:51
(e)67:89
Q14. Average number of students enrolled in B and D in 2015 is how much more or less than the average number of students enrolled in C and E in 2016?
(a)40
(b)20
(c)60
(d)80
(e)10
Solutions


 Data Interpretation Questions for IBPS R...
 Data Interpretation Questions For Bank E...
 Data Interpretation Questions for SBI PO...


