|
The graph shows monthly income (in thousand) in six different years by Adil, Suhana and Jaya.
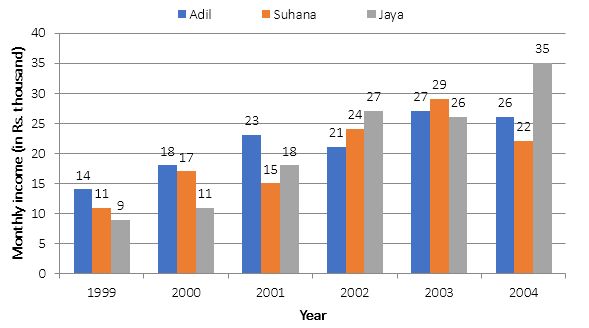
Q1. What was the difference between the average monthly income of Adil in all the years together and Suhana’s monthly income in the year 2001?
(a) Rs. 5.5 thousand
(b) Rs. 6.5 thousand
(c) Rs. 7.5 thousand
(d) Rs. 8.5 thousand
(e) Rs. 6 thousand
Q2. What is the ratio of Adil’s monthly income in the year 2000, Suhana’s monthly income in the year 2001 and Jaya’s monthly income in the year 1999?
(a) 6 : 3 : 5
(b) 6 : 4 : 5
(c) 5 : 6 : 4
(d) 5 : 4 : 7
(e) 6 : 5 : 3
Q3. In which year was the difference between Jaya’s and Adil’s monthly income the second highest?
(a) 1999
(b) 2000
(c) 2004
(d) 2001
(e) 2002
Q4. The monthly income of Suhana in the year 2003 was approximately what percentage of the monthly income of Jaya in the year 2004?
(a) 72%
(b) 89%
(c) 83%
(d) 67%
(e) 95%
Q5. What was the percentage increase in the monthly income of Jaya in the year 2002 as compared to the previous year?
(a) 50%
(b) 150%
(c) 160%
(d) 60%
(e) 40%
Directions (6-10): The following bar graph shows the total no. of children from three states of India who died due to poor nourishment in five different year. Study the graph carefully to answer the following questions.
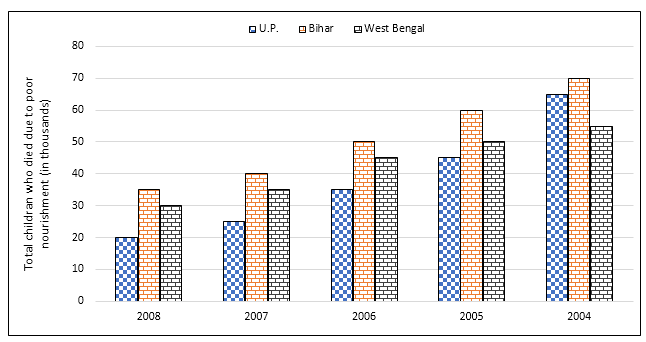
Q6. What is the average no. of children who died due to poor nourishment in Bihar over all the years together?
(a) 51,500
(b) 51,000
(c) 52,000
(d) 51,250
(e) 55,000
Q7. If the ratio of boys to girls is 5 : 3 in Bihar for each year who died due to poor nourishment then the no. of boys who died in Bihar in the year 2007 and 2005 together is approximately what percent of total no. of children who died in the same state in the same years together?
(a) 61.5%
(b) 75.75%
(c) 62.5%
(d) 60.5%
(e) 56.5%
Q8. The no. of children who died in West Bengal in the year 2004 and 2006 together is approximately what percent more or less than the no. of children who died in the year 2005 and 2007 together in same state?
(a) 18% more
(b) 18% less
(c) 12% more
(d) 12% less
(e) 27% more
Q9. What is the average of difference between total no. Of children who died in all the three states together in year 2004 and 2008?
(a) 55,200
(b) 52,500
(c) 51,500
(d) 50,500
(e) 54,700
Q10. If in year 2003, the total no. of children who died was 22% more than that of the year 2004 in all the three states and ratio of boys to girls in the year 2003 were 7 : 4 then the no. of girls who died in the year 2003 was what percent more/less than the no. of boys who died in the year 2003 in all the three states together? (up to two decimal places)
(a) 40.23%
(b) 48.26%
(c) 64.28%
(d) 42.86%
(e) 52.86%
Directions (11-15): Study the following bar graph which shows export of three different things (in tonnes) over five different years by India to foreign countries
Observe the bar-graph and answer the following questions.
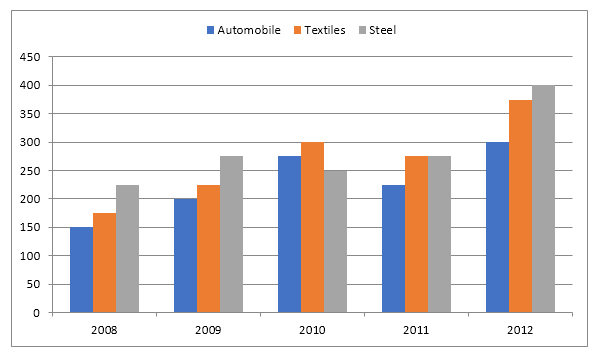
Q11. Automobiles exported in the year 2012 are approximately what percent of automobiles exported in the year 2011?
(a) 142%
(b) 117%
(c) 133%
(d) 148%
(e) 153%
Q12. Find the average of Textiles exported over all the years (in tonnes)
(a) 210 tonnes
(b) 250 tonnes
(c) 270 tonnes
(d) 240 tonnes
(e) 310 tonnes
Q13. The steel exported in year 2011 and 2012 together is what percent of Automobile exported in 2010 and 2011 together?
(a) 165%
(b) 155%
(c) 145%
(d) 135%
(e) 125%
Q14. Find the difference between total export of Textiles and total export of Steel over all the years.
(a) 75 tonnes
(b) 85 tonnes
(c) 60 tonnes
(d) 65 tonnes
(e) 40 tonnes
Q15. What is the ratio of total export of Automobiles to total export of textiles during first three years together?
(a) 28 : 25
(b)25 : 28
(c) 4 : 7
(d) 7 : 4
(e) 21 : 29


 Quantitative Aptitude Quiz For IDBI AM/E...
 Quantitative Aptitude Quiz For IBPS RRB ...