

Directions (1- 5): line-chart given below shows the number of cars produced (in thousands) by five different companies Maruti, Suzuki, Tata Motors, Honda and Renault India in three different years. Study the data carefully and answer the following questions.
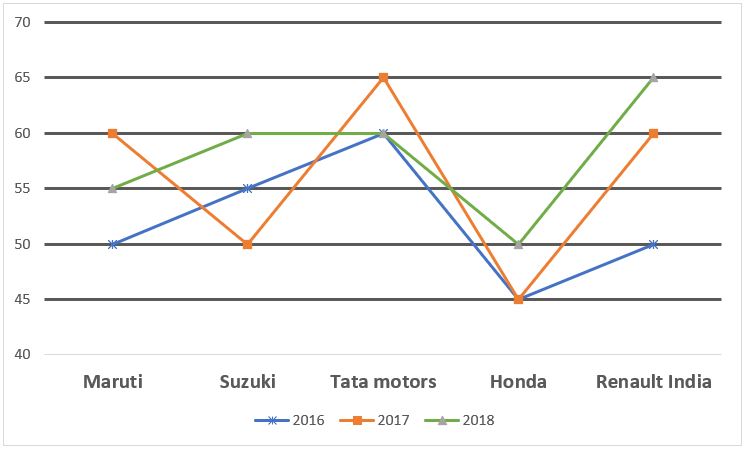
Q1. Total car produced by Maruti, Suzuki and Honda in the year 2016 together is what percent more or less than the sum of the total car produced by Tata motors in 2017 and Maruti in 2018?
(a) 20%
(b) 24%
(c) 26%
(d) 25%
(e) 28%
Q2. The average number of cars produced by Maruti, Renault India and Tata motors in 2018 is how much more or less than the average number of cars produced by Tata motors and Honda in 2017?
(a) 5000
(b) 6000
(c) 4000
(d) 7000
(e) 5500
Q3. Find the ratio of the total car produced by Renault India in 2017 and 2018 together to the sum of total car produced by Suzuki in 2016 and 2017 together and total car produced by Honda in 2017 and 2018 together?
(a) 7 : 8
(b) 5 : 8
(c) 8 : 3
(d) 8 : 9
(e) 5 : 9
Q4. If in 2019 total car produced by Suzuki and Tata increases by 10% and 30% respectively over 2018 and total car produced by Honda decreases by 40% in 2019 over 2018, then find the total production of these three companies in 2019?
(a) 170000
(b) 180000
(c) 160000
(d) 174000
(e) 168000
Directions (6-10): Find the approximate value of question marks (?) in following questions?
Q7. 15.812% of 1600.125 + ? % of 1199.98 = 19.88 × 121.98
(a) 182
(b) 142
(c) 326
(d) 286
(e) 216
Q8. (7.98)³ + (14.88)² – (12. 01)² = ? – 1219.812 – 1749.98
(a) 3643
(b) 3425
(c) 3416
(d) 3563
(e) 3521
Q9. 19.825 × √(?) = 63.91% of 399.98 + 11.95% of 1200.01
(a) 300
(b) 500
(c) 420
(d) 350
(e) 400
Q10. (?)² + 14.01% of 1599.98 = 59.01 × 12.025
(a) 18
(b) 28
(c) 22
(d) 36
(e) 32
Direction (11-15): Study the pie chart carefully & answer the following questions.
Pie-chart given below shows the number of books sold by Adda 247 in year 2016.
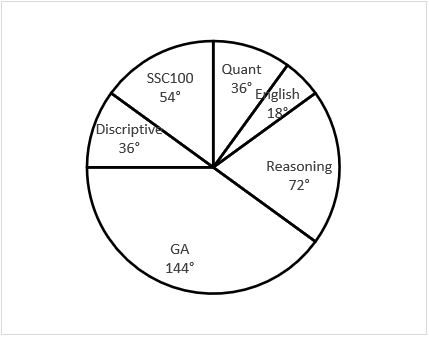
Note:
(i) Ratio of number of books sold by Adda 247 in year 2016 to 2017 is in ratio 4 : 5.
(ii) Percentage distribution is same in both the years.
Q11. Total number of Quant and Reasoning books sold together in year 2016 is what percent of the total number of SSC100 and descriptive books sold together in year 2017 ?
(a) 68%
(b) 88%
(c) 96%
(d) 82%
(e) 72%
Q12. If total English books sold in year 2016 is 648. Then find the difference between the descriptive and SSC100 books sold in year 2017 ?
(a) 810
(b) 720
(c) 840
(d) 870
(e) 750
Q13. Find the ratio of total GA and Quant books sold together in year 2016 to the total Reasoning and English books sold together in year 2017 ?
(a) 7 : 5
(b) 5 : 3
(c) 8 : 3
(d) 8 : 5
(e) 5 : 8
Q14. If GA books sold in year 2016 is 576 then SSC100 books sold in year 2017 is what percent of the English books sold in year 2016 ?
(a) 375%
(b) 450%
(c) 425%
(d) 350%
(e) 250%
Q15. If reasoning books sold in year 2017 is 360, then find the average number of descriptive and GA books sold in year 2017 ?
(a) 420
(b) 475
(c) 380
(d) 360
(e) 450
Solutions


 Quantitative Aptitude Quiz For Bank Main...
 Quantitative Aptitude Quiz For Bank Foun...


