
Directions (1-5): Study the radar chart given below and answer the following questions.
Radar chart shows the number of employees (in ’00) in 5 different departments (A, B, C, D & E) of a company in 2016, 2017 & 2018.
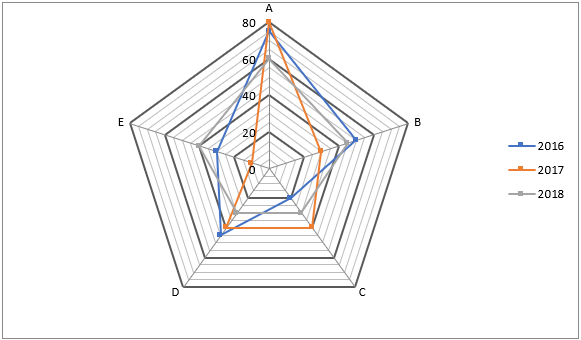
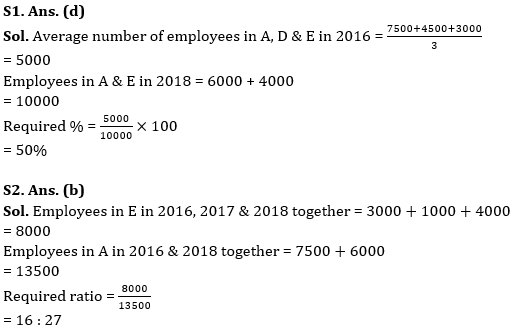
Q1. Average number of employees in A, D & E in 2016 is what percent of employees in A & E together in 2018?
(a) 40%
(b) 20%
(c) 80%
(d) 50%
(e) 90%
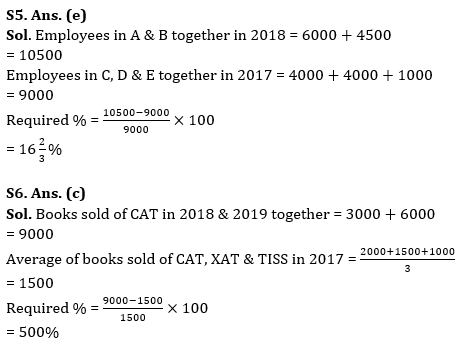
Q2. Find ratio of employees of E in 2016, 2017 & 2018 together to employees in A in 2016 & 2018 together.
(a) 11 : 15
(b) 16 : 27
(c) 13 : 16
(d) 3 : 4
(e) 2 : 3
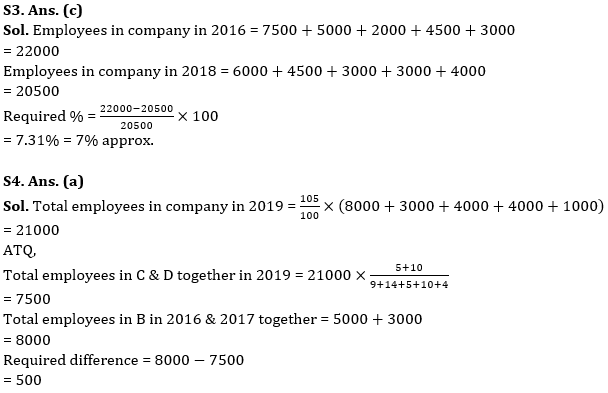
Q3. Employees in company in 2016 are approximately what percent more or less than employees in company in 2018?
(a) 11%
(b) 10%
(c) 7%
(d) 5%
(e) 9%
Q4. If in 2019 total employees in company are increased by 5% as compared to total employees in company in 2017 and ratio of employees (A : B : C : D : E) in 2019 is 9 : 14 : 5 : 10 : 4, then find total employees in C & D together in 2019 are how much more or less than total employees in B in 2016 & 2017 together.
(a) 500
(b) 2500
(c) 2000
(d) 1000
(e) 1500
Directions (6-10): Study the radar graph given below and answer the following questions.
Radar graph shows the number of books sold of 5 different entrance exams (CAT, XAT, SNAP, TISS & NMAT) in 2017, 2018 & 2019.
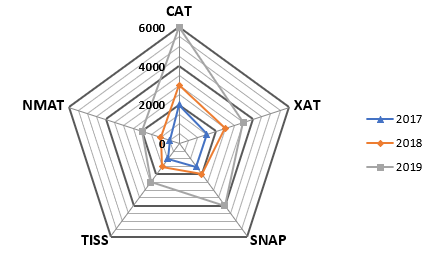
Q6. Books sold of CAT in 2018 & 2019 together are what percent more or less than average of books sold of CAT, XAT & TISS in 2017?
(a) 900%
(b) 200%
(c) 500%
(d) 100%
(e) 700%
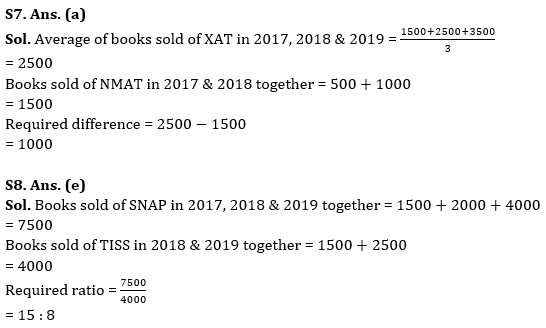
Q7. Average of books sold of XAT in 2017, 2018 & 2019 are how much more/less than books sold of NMAT in 2017 & 2018 together?
(a) 1000
(b) 600
(c) 1300
(d) 1600
(e) 1200
Q8. Find ratio of books sold of SNAP in 2017, 2018 & 2019 together to books sold of TISS in 2018 & 2019 together.
(a) 5 : 2
(b) 2 : 5
(c) 8 : 15
(d) 4 : 7
(e) 15 : 8
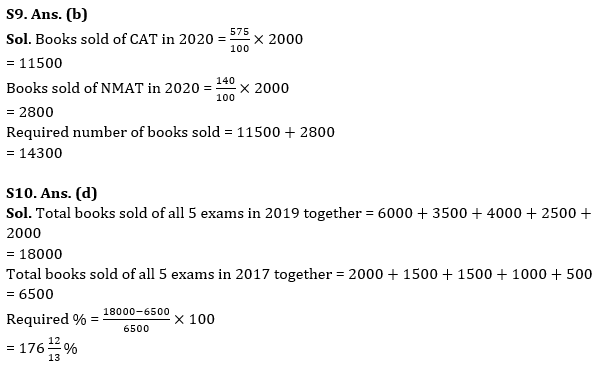
Q9. If books sold of CAT in 2020 is increased by 475% as compared to books sold of CAT in 2017 and books sold of NMAT in 2020 is increased by 40% as compared to books sold of NMAT in 2019, then find books sold of CAT & NMAT together in 2020.
(a) 15400
(b) 14300
(c) 17600
(d) 12100
(e) 14800
Solutions


. . .

 Data Interpretation Questions for IBPS R...
 Data Interpretation Questions For Bank E...
 Data Interpretation Questions for SBI PO...