

Directions (1-5): Please understand the data carefully and answer the question.
The following pie chart shows the consumption of five different cold drinks, Pepsi, Coca-Cola, Dew, Sprite and Limca, by a society, whereas the table shows the ratio of number of males, female and kids, who consumed these cold drinks.
Note: Total cold drinks consumed=50000
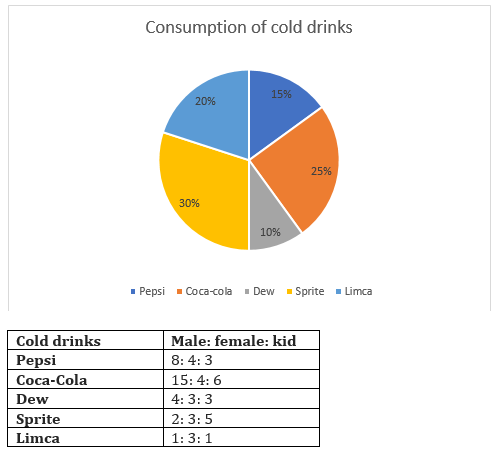
Q1. Find the respective ratio of number of males who consumed Limca to number of females who consumed Pepsi?
(a)2: 1
(b)1: 1
(c)1:2
(d)2:3
(e)3:2
Q2. Find the difference between the total number of males who consumed Sprite and Dew together and the total number of females and kids who consumed Dew?
(a)2500
(b)500
(c)1000
(d)2000
(e)1500
Q3. Find the total number of kids who consumed their respective cold drinks (Pepsi, Coca-Cola, Dew, Sprite and Limca).
(a)16000
(b)11500
(c)13000
(d)17500
(e)15500
Q4. Find the total number of kids who consumed Sprite is what percent of the total number of kids who consumed Pepsi?
(a)500%
(b)250%
(c)600%
(d)450%
(e)150%
Q5. Find the total number of Coca-Cola consumed by society is what percent more/less than the total number of Sprite and Limca together consumed by the society?
(a)150%
(b)75%
(c)50%
(d)100%
(e)125%
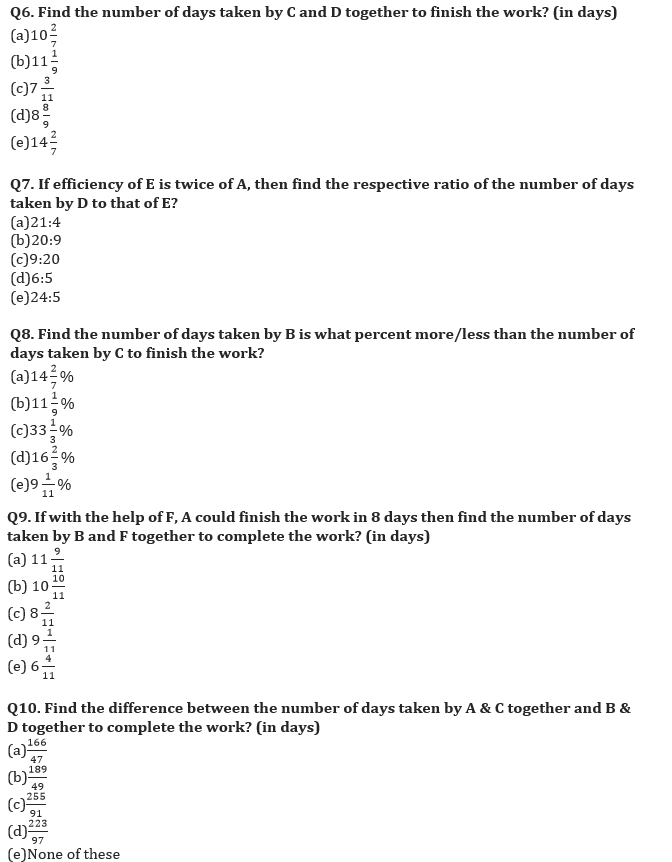
Directions (6-10): Please understand the data carefully and answer the question.
There are four persons A, B, C and D. A could do half of a work in 5 days while A and B together could finish the same work in 6 days. C takes 3 more days than B and D’s efficiency is 75% of C.
Directions (11-15): Please understand the data carefully and answer the question.
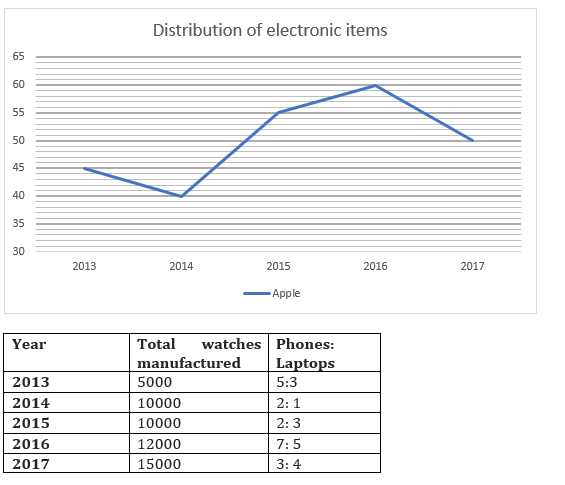
The line graph below shows the total number of electronic items (phones, laptops and watches only) in thousand (‘000) manufactured by Apple in five different years, 2013, 2014, 2015, 2016 and 2017.
The table below shows the total number of watches manufactured and the ratio of number of phones to laptops manufactured in a particular year.
Q11. Find the average number of laptops manufactured by Apple in all five years together?
(a)21300
(b)15600
(c)20100
(d)16800
(e)18400
Q12. Find the number of phones manufactured by Apple in year 2016 is what percent of total number of electronic items manufactured by Apple in year 2017?
(a)56%
(b)72%
(c)88%
(d)44%
(e)62%
Q13. Find the difference between the total number of watches and phones manufactured by Apple in year 2016 and 2014 together?
(a)5000
(b)25000
(c)20000
(d)10000
(e)15000
Q14. Find the respective ratio of the number of laptops manufactured by Apple in year 2017 to the number of phones manufactured by Apple in year 2013?
(a)5:3
(b)4:5
(c)2:3
(d)3:2
(e)5:4
Q15. If in year 2018, there is increase of 30% in all items manufactured in previous year, then find the respective ratio of total items manufactured in year 2018 to that of 2013?
(a)6:11
(b)11:6
(c)13:9
(d)9:7
(e)7:9
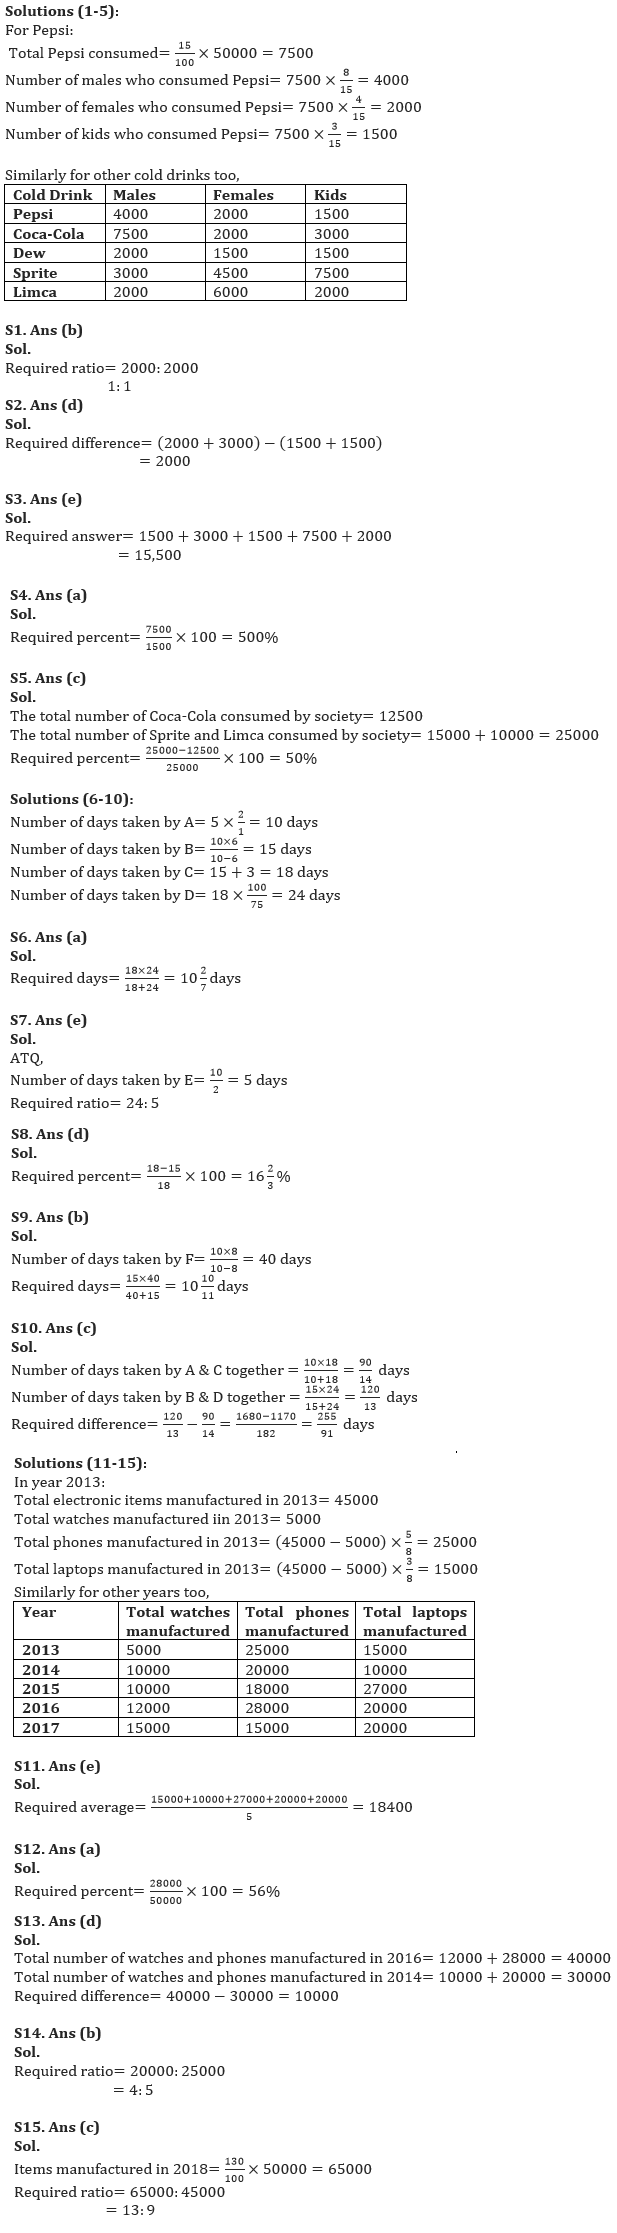
Solutions


 Daily Current Affairs and GK Updates (5t...
 Self Study vs Coaching for IBPS SO
 NKGSB Bank Clerk Recruitment 2026 for 30...


