

Directions (1-5): Given below is a pie-graph that shows percentage of HR managers out of total HR managers in five different companies i.e. A, B, C, D and E in March, 2016.
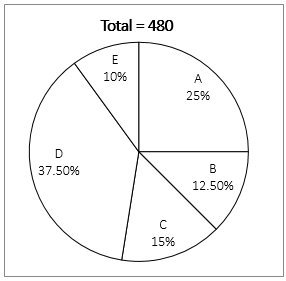
Note: Any HR manager leaves or enters a company only in April 2017.
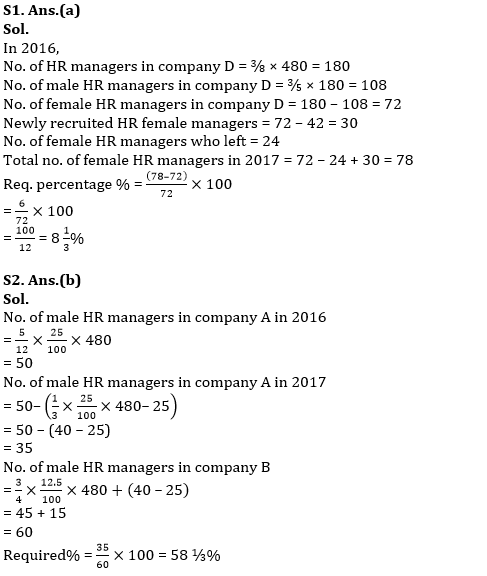
Q1. The ratio of male HR managers to female HR managers in company D in 2016 was 3 : 2 and 24 female HR managers left the company D in 2017. Find the percentage increase in number of female HR managers in company D in 2017 if there were 42 male managers out of newly recruited 72 managers.
(a) 8 ⅓%
(b) 8%
(c) 9%
(d) 6 ⅔%
(e) none of these
Q2. In 2017 33 ⅓% HR managers from company A shifted to company B. If ratio of male to female HR managers in company A and B in 2016 was 5 : 7 and 3 : 1 respectively and 25 female manager left company A, then find remaining male managers in company A is what percent of number of male managers in company B in 2017.
(a) 68 ⅓%
(b) 58 ⅓%
(c) 48 ⅓%
(d) 38 ⅓%
(e)none of these
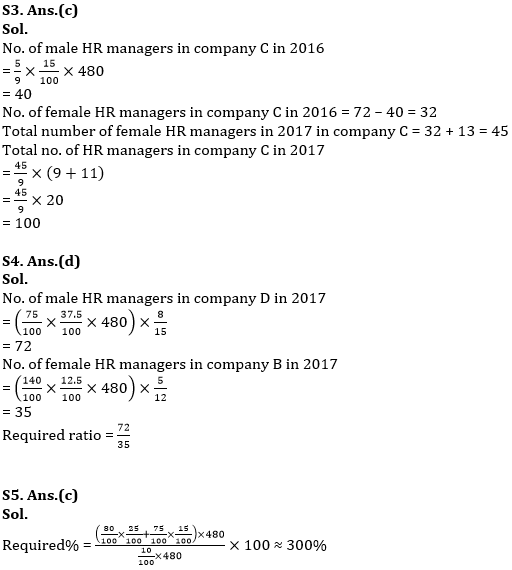
Q3. The ratio of male to female HR managers in company C in 2016 was 5 : 4 while in 2017 the ratio was 11 : 9. If 13 female HR managers joined company C in 2017, then find total number of HR managers in company C in 2017.
(a)200
(b)150
(c)100
(d)250
(e)none of these
Q4. In 2017, 25% of HR managers from company D left the job and company B recruited 40% more HR managers more than the number of HR managers it had in 2016. If ratio of male to female HR managers in company D and B becomes 8 : 7 and 7 : 5 respectively, then find the ratio of number of male HR managers in company D in 2017 to number of female HR managers in company B in 2017.
(a)71:32
(b)45:34
(c)65:36
(d)72:35
(e)none of these
Q5. If in 2017 company A and C fired 20% and 25% of their HR managers respectively, then find the remaining number of HR managers in these two companies in 2017 is what percent of number of total HR managers in company E in 2016. (approximate value)
(a)100%
(b)200%
(c)300%
(d)250%
(e)none of these
Directions (6-10): The following line graph shows the number of students enrolled in two different courses (B.Tech, & Medical) in a college during 2013 to 2017. Study the given graph carefully and answer the following questions.
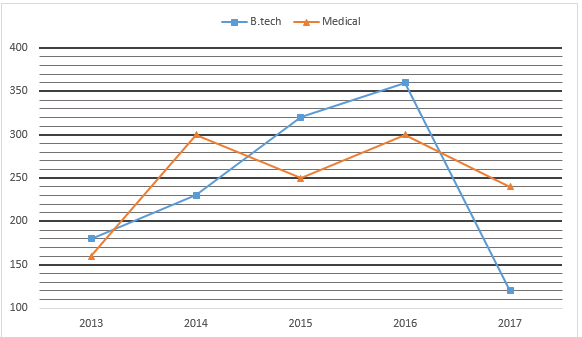
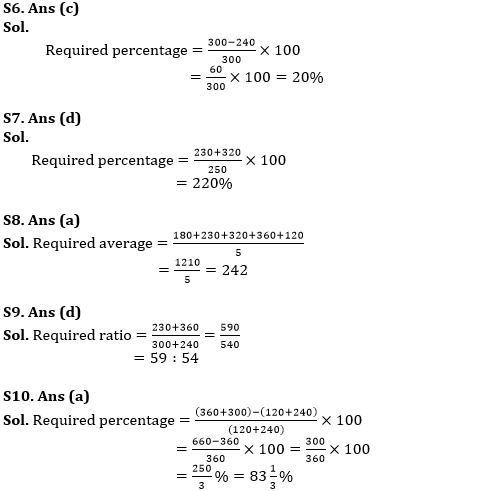
Q6. What was the percent increase/decrease in number of students in medical in the year 2017 as compared to previous year?
(a) 12.5%
(b) 25%
(c) 20%
(d) 22.5
(e) 33.33%
Q7. Number of students enrolled in B.Tech in the year 2014 and 2015 together was what percent of the total number of students enrolled in Medical in the year 2015?
(a) 500/11%
(b) 120%
(c) 150%
(d) 220%
(e) 70%
Q8. Find the average no. of students enrolled in B.Tech all over the years.
(a) 242
(b) 422
(c) 264
(d) 342
(e) 282
Q9. What is the ratio between students enrolled in B.tech in year 2014 and 2016 together to that of Medical in year 2017 and 2016 together?
(a) 54 : 59
(b) 9 : 10
(c) 55 : 58
(d) 59 : 54
(e) 57 : 59
Q10. Total number of students enrolled in year 2016 is how much percentage more or less than total no. of students enrolled in year 2017? (total students = medical + B-tech)
(a) 83⅓%
(b) 85⅓%
(c) 87⅔%
(d) 90 %
(e) 93 ⅓%
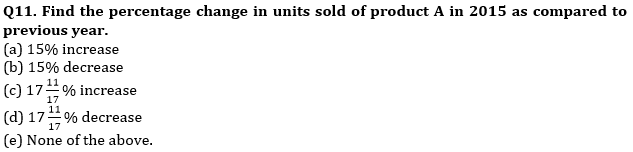
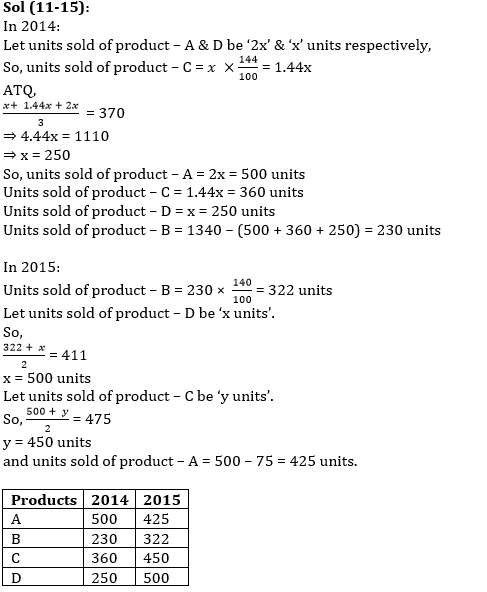
Directions (11-15): Data given below gives the information regarding four different products A, B, C and D (in units) sold by a company in year 2014 and 2015. Read the data carefully to answer the following questions.
In 2014 – Ratio of units sold of product A to product D is 2 : 1. Units sold of product C is 144% of units sold of product D. Average number of units sold of product A, C and D is 370 units. Total units sold of product A, B, C and D is 1340 units.
In 2015 – Average number of units sold of product C & D is 475 units. Units sold of product A is 75 units less than the units sold of product D. Units sold of product B is increased by 40% as compared to previous year and average units sold of product B & D is 411 units.
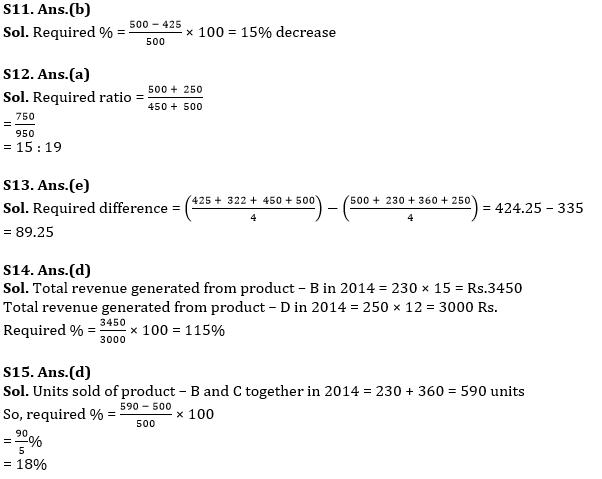
Q12. Find the ratio of units sold of product A & D together in 2014 to units sold of product C & D together in 2015.
(a) 15 : 19
(b) 12 : 17
(c) 5 : 3
(d) 9 : 7
(e) 11 : 6
Q13. Find the difference in average units sold of product A, B, C and D in 2014 and average units sold of product A, B, C and D in 2015.
(a) 67.25
(b) 73.25
(c) 82.25
(d) 87.25
(e) 89.25.
Q14. In 2014, selling price of per unit of product D is Rs.12 and selling price of per unit of product B is Rs.15. Find total revenue generated from product B in 2014 is what percent of total revenue generated from product D in 2014?
(a) 125%
(b) 145%
(c) 135%
(d) 115%
(e) 105%
Q15. Units sold of product B & C together in 2014 is what percent more than units sold of product – D in 2015?
(a) 12%
(b) 30%
(c) 24%
(d) 18%
(e) 36%
Solutions


 Data Interpretation Questions for IBPS R...
 Data Interpretation Questions For Bank E...
 Data Interpretation Questions for SBI PO...


