

Directions (1-5): Study the radar chart given below and answer the following questions.
Radar chart shows the number of employees (in ’00) in 5 different departments (A, B, C, D & E) of a company in 2016, 2017 & 2018.
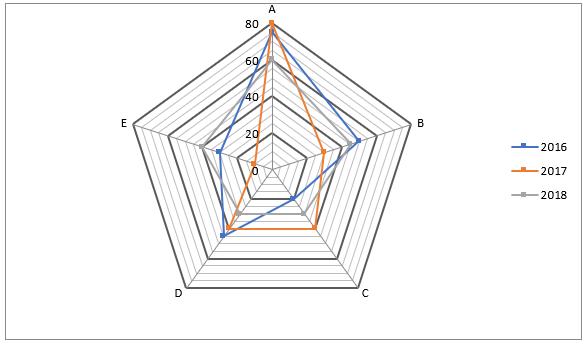
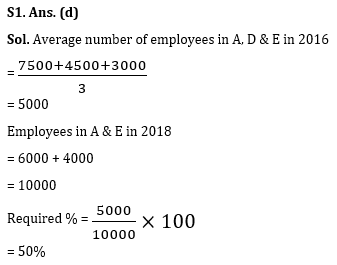
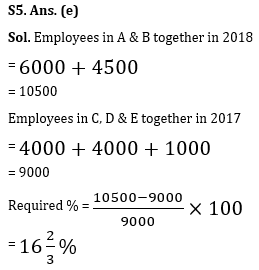
Q1. Average number of employees in A, D & E in 2016 is what percent of employees in A & E together in 2018?
(a) 40%
(b) 20%
(c) 80%
(d) 50%
(e) 90%
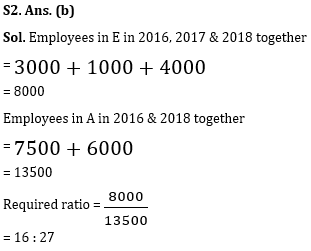
Q2. Find ratio of employees of E in 2016, 2017 & 2018 together to employees in A in 2016 & 2018 together.
(a) 11 : 15
(b) 16 : 27
(c) 13 : 16
(d) 3 : 4
(e) 2 : 3
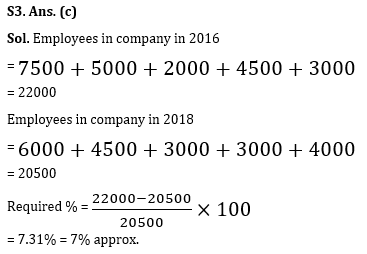
Q3. Employees in company in 2016 are approximately what percent more or less than employees in company in 2018?
(a) 11%
(b) 21%
(c) 7%
(d) 3%
(e) 15%
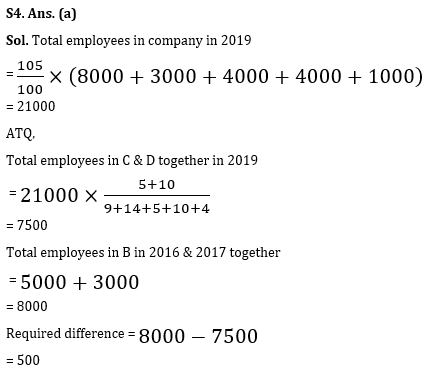
Q4. If in 2019 total employees in company are increased by 5% as compared to total employees in company in 2017 and ratio of employees (A : B : C : D : E) in 2019 is 9 : 14 : 5 : 10 : 4, then find total employees in C & D together in 2019 are how much more or less than total employees in B in 2016 & 2017 together.
(a) 500
(b) 2500
(c) 2000
(d) 1000
(e) 1500
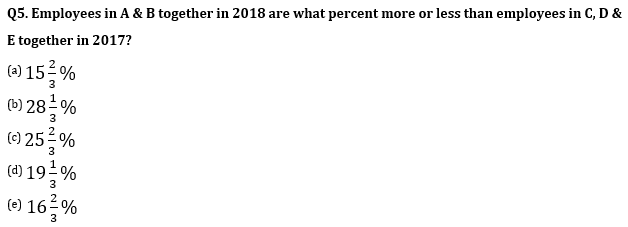
Directions (6-10): Study the bar-graph carefully & answer the following questions.
Bar-graph given below shows the percentage of total defective cars sold out of total cars sold by four different shops. Total cars sold by four shops = 1200. Ratio between cars sold by X : Y : Z : K = 1 : 3 : 2 : 4
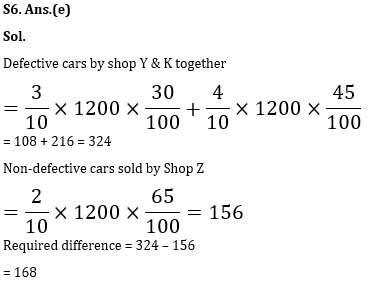
Q6. Defective cars sold by shops Y & K together are how much more/less than total non-defective cars sold by shop Z?
(a) 124
(b) 178
(c) 194
(d) None of these
(e) 168
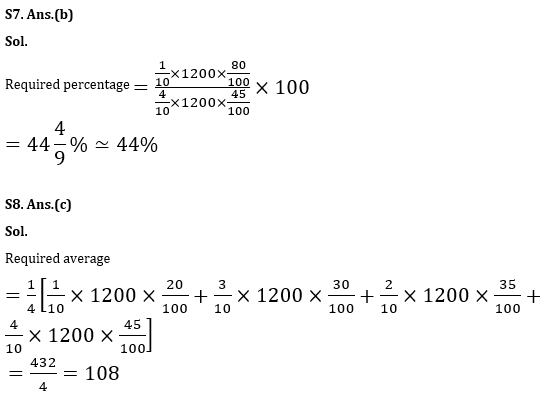
Q7. Non-defective cars sold by shop X is approximately what percent of defective cars sold by shop K?
(a) 52%
(b) 44%
(c) 36%
(d) 64%
(e) 58%
Q8. Find the average number of defective cars sold by all the shops together?
(a) 128
(b) 112
(c) 108
(d) 132
(e) 106
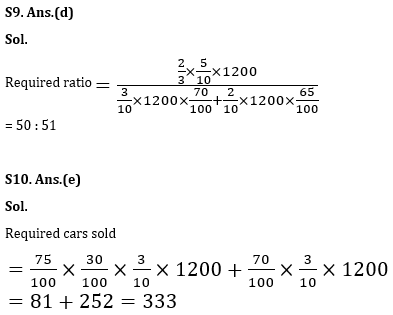
Q9. Find the ratio between 2/3rd of cars sold by shop X & K together to total non-defective cars sold by shop Y & Z together?
(a) None of these
(b) 60 : 61
(c) 55 : 56
(d) 50 : 51
(e) 20 : 21
Q10. If 25% of defective cars sold by shop Y are returned back to the same shop, then find total cars which are sold (defective and non-defective) by shop Y?
(a) 388
(b) None of these
(c) 288
(d) 324
(e) 333
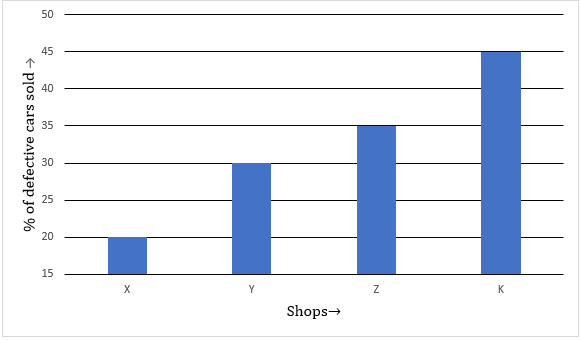
Directions (11–15)- Table given below gives information about no. of article manufactured by company and % of non-defective article out of them. Table also gives ratio of non-defective article sold to defective article sold by five different companies. Company A, C and D sold 90% and company B and E sold 80% of total manufactured articles.
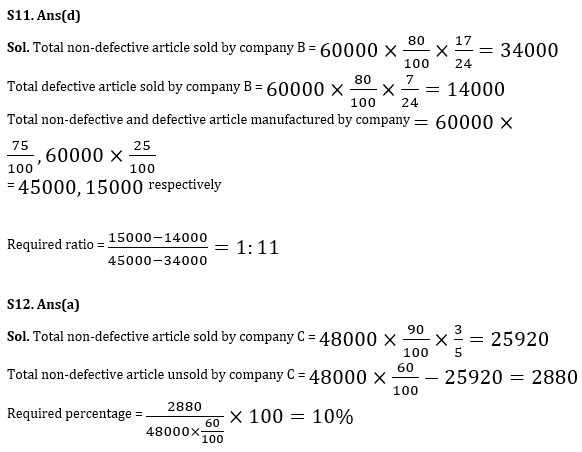
Q11. Find ratio of unsold defective article to unsold non-defective article of company B?
(a) 25 : 16
(b) 5 : 4
(c) 12 : 5
(d) 1 : 11
(e) 4 : 5
Q12. Total non-defective unsold articles of company C are what percent of non-defective articles of same company?
(a) 10%
(b) 20%
(c) 25.5%
(d) 24.5%
(e) 26%
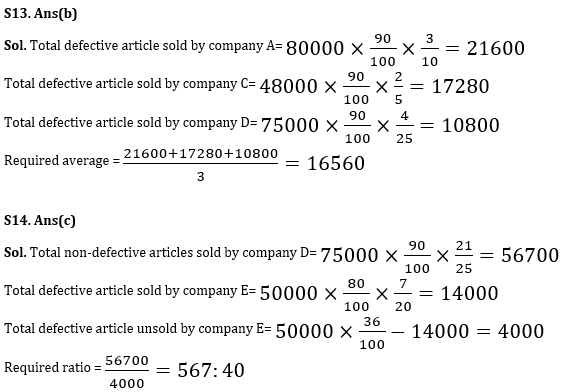
Q13. What is average of defective articles sold by companies A, C and D?
(a) 9936
(b) 16560
(c) 16636
(d) 15560
(e) 24840
Q14. What is the ratio of non-defective article sold by company D to defective article unsold by company E?
(a) 27:2
(b) 469:39
(c) 567:40
(d) 465:37
(e) None of these
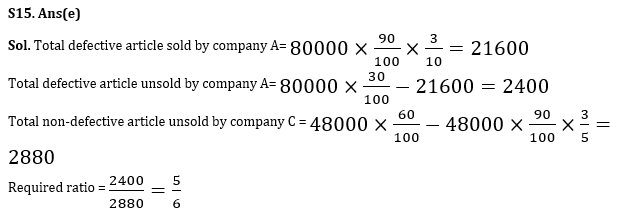
Q15. What is ratio of total defective unsold article of company A to total unsold non-defective article of company C?
(a) 11/13
(b) 1/3
(c) 3/4
(d) 2/3
(e) 5/6
Solutions


 Data Interpretation Questions for IBPS R...
 Data Interpretation Questions For Bank E...
 Data Interpretation Questions for SBI PO...


