

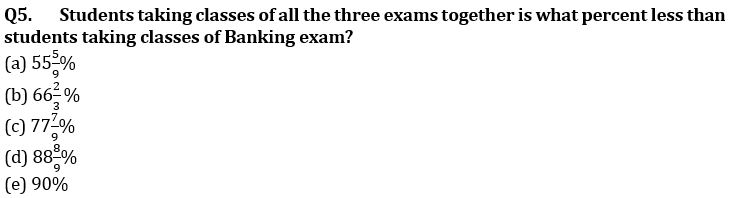
Direction (1-5): Read the data carefully and answer the questions.
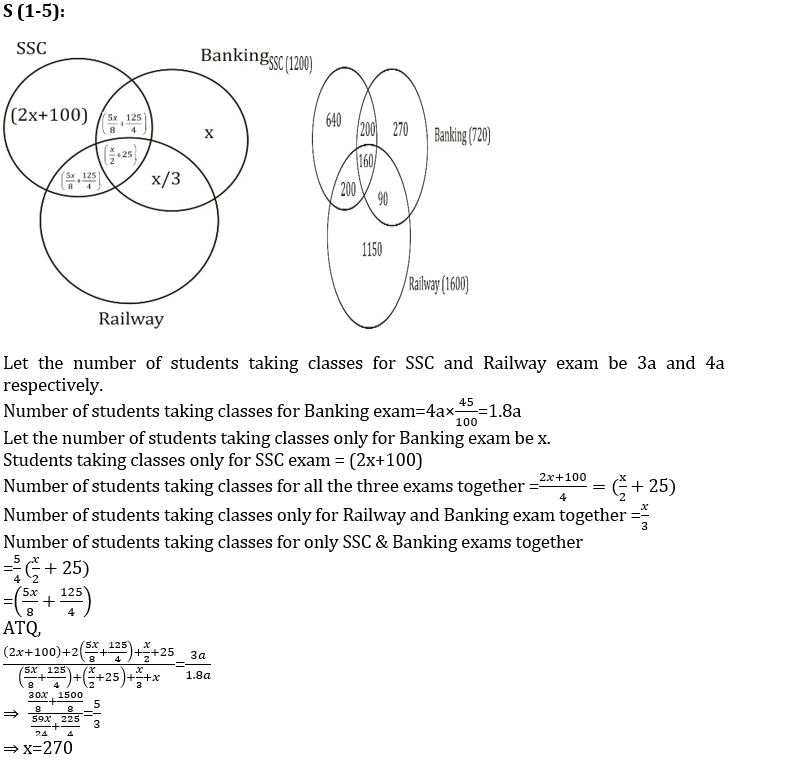
In a coaching institute, the ratio of students taking classes for SSC and Railway exam is 3:4. The number of students taking classes only for SSC is 100 more than twice the number of students taking classes only for Banking and 300% more than the number of students taking classes for all these exams together. The number of students taking classes for only SSC & Banking together and for only SSC & Railway together is equal and is 25% more than number of students taking classes for all the three exams together. Number of students taking classes only for Banking and Railway exam together is 33⅓% of students taking classes only for Banking exam. The number of students taking classes for Banking exam is 45% of the students taking classes for Railway exam.
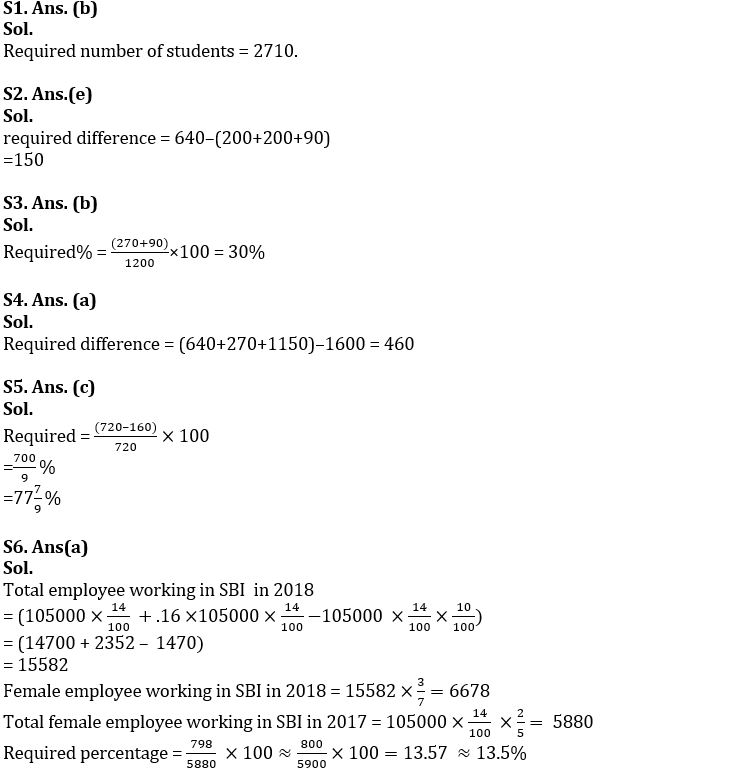
Q1. Find the total number of students in the Coaching Institute?
(a) 2680
(b) 2710
(c) 2940
(d) 2830
(e) 2870
Q2. Total number of students who are taking classes of only two exams together are how much more or less than students taking classes of only SSC exam?
(a) 120
(b) 125
(c) 130
(d) 140
(e) 150
Q3. Total number of students who are taking Banking classes but not SSC classes are what percent of number of students taking classes for SSC exam?
(a) 20%
(b) 30%
(c) 25%
(d) 27 ½ %
(e) 33 ⅓ %
Q4. Find difference between number of students taking only one classes and the students taking classes of Railway exam?
(a) 460
(b) 450
(c) 440
(d) 480
(e) 490
Direction (6 – 10): Given below pie chart shows percent breakup of number of employees working in six different government sector banks in the years 2017. Table shows percentage of male employees more or less than female employees in these banks in the years 2017 and new joining percentage & retired employees’ percentage in the years 2018 calculated over total employee at the end of the year 2017
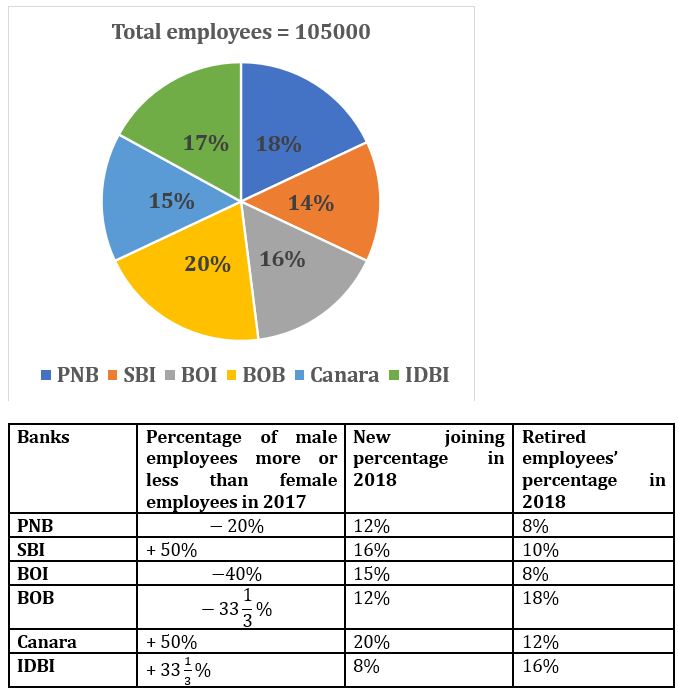
Note – + % shows male employee more than female employee and -%shows male employee less than female employee. Total employee working during a year calculated at the end of years.
Example –
Total employee working in 2018 = Total employee working in 2017 + New joining – Retired employees’
Q6. If ratio of male employee to female employee in SBI in the year 2018 is 4 : 3, then find approximate percentage increase in number of female employee working in 2018 over the 2017 in SBI?
(a) 13.5%
(b) 8.5%
(c) 18.5%
(d) 20%
(e) 22.5%
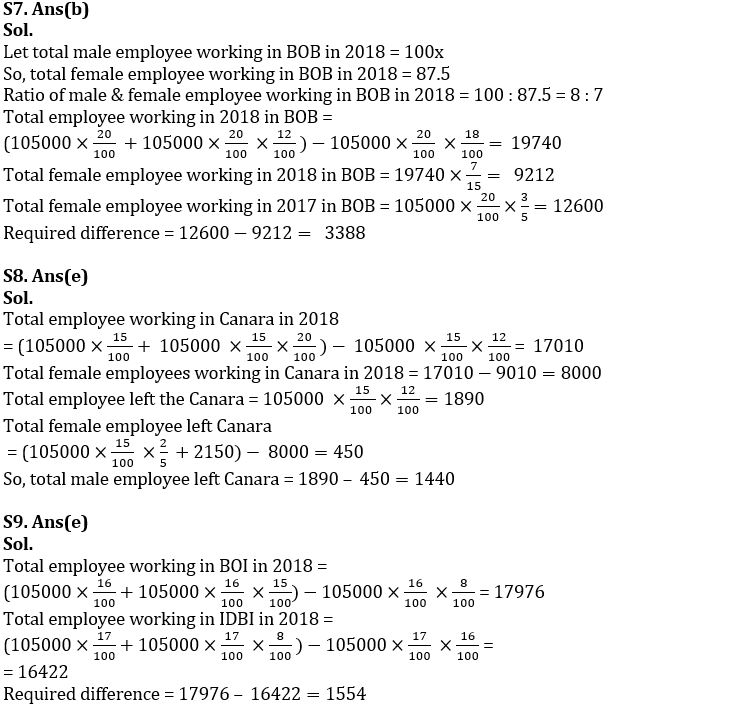
Q7. If total female employee working in BOB in 2018 is 12.5% less than that of male employee working in BOB in that year, then find difference between female employee working in BOB in 2017 & 2018?
(a) 3368
(b) 3388
(c) 3356
(d) 3316
(e) 3348
Q8. If total male employee in Canara in the year 2018 is 9010 and 2150 female employee joined the Canara in 2018, then find number of male employees who retired?
(a) 1400
(b) 1040
(c) 1740
(d) 1240
(e) 1440
Q9. Find difference between total employee working in BOI to total employee working in IDBI in the year 2018?
(a) 1544
(b) 1654
(c) 1254
(d) 1354
(e) 1554
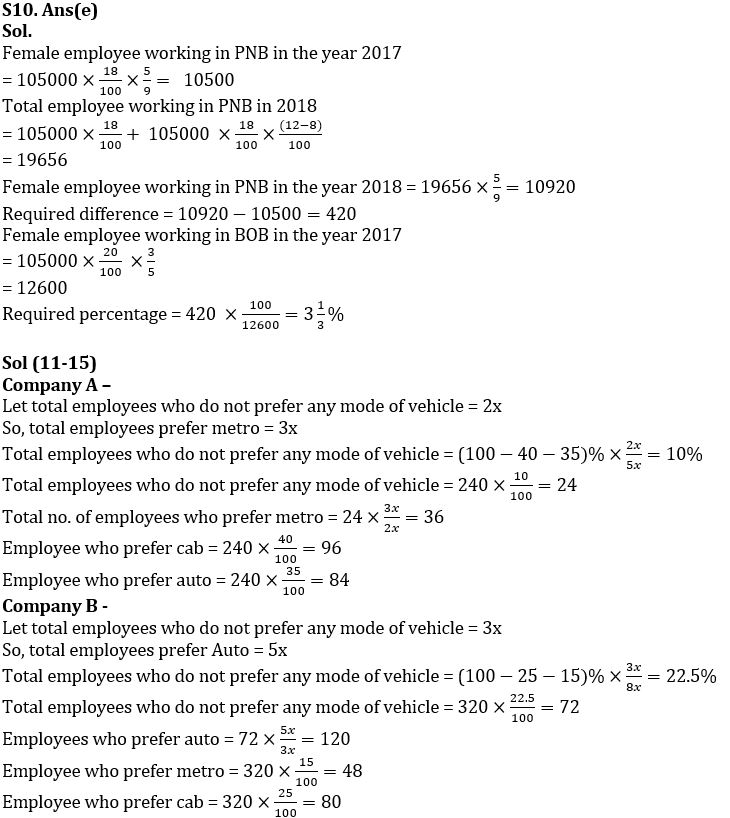
Q10. If ratio of male employee to female employee in PNB in 2018 is same as in the year 2017, then difference between number of female employees working in PNB in given two years is what percent of female employee working in BOB in the year 2017?
(a) 6 ⅓%
(b) 5%
(c) 2 ⅓%
(d) 3
(e) 3 ⅓%
Direction (11 – 15) : Bar graph given below shows number of employees working in four different companies and table shows percentage of employee prefer three modes of vehicle for going office & some data given in paragraph. Read the data carefully and answer the questions.
Note – An employee using one out of three modes of vehicle or no modes of vehicle out of three.
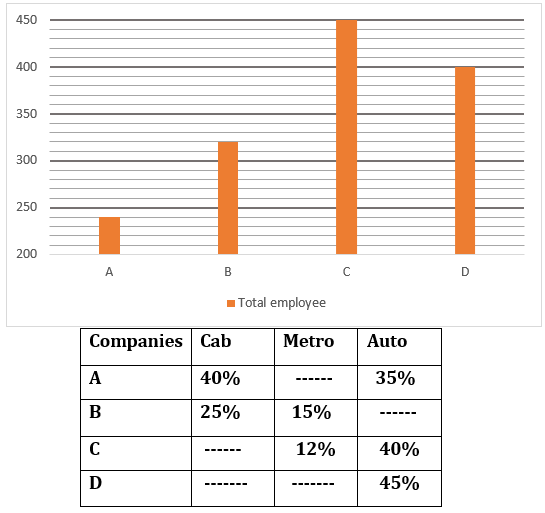
In company A, total employee prefer Metro are 50% more than total employee who do not prefer any mode of vehicle.
In company B, total employee prefer Auto are 66 ⅔% more than total employee who do not prefer any mode of vehicle.
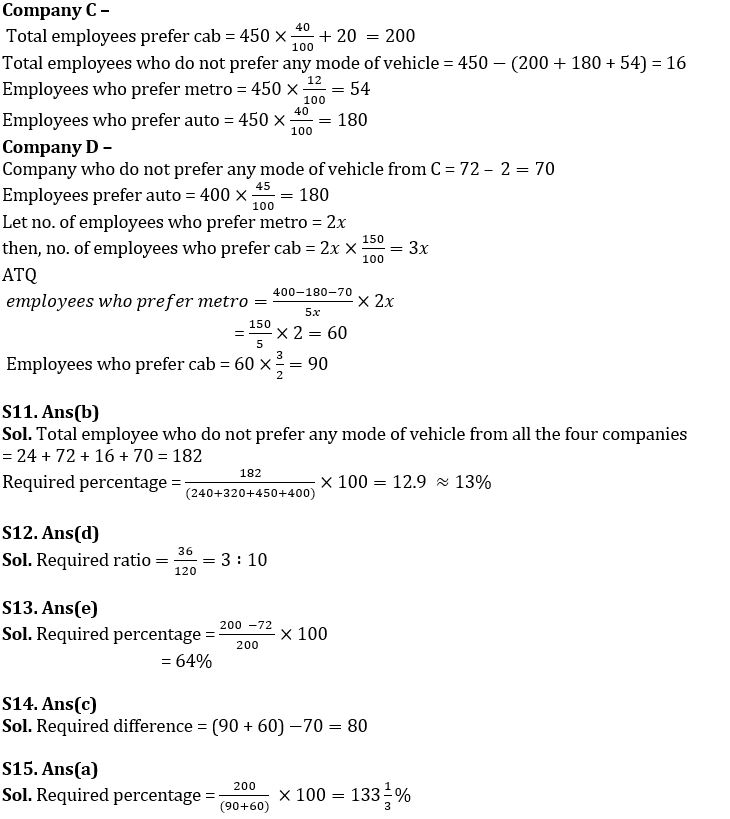
In company C, total employee prefer Cab are 20 more than total employee prefer Auto.
In company D, number of employees prefer Cab are 50% more than number of employees prefer Metro and number of employees who do not prefer any mode of vehicle are 2 less than do not prefer any mode of vehicle from company B.
Q11. Find the percentage of employee who do not prefer any mode of vehicle from all the four companies (approximate)?
(a) 16%
(b) 13%
(c) 18%
(d) 15%
(e) 20%
Q12. Find the ratio of employee prefer Metro from A to total employee prefer Auto from B?
(a) 3 : 8
(b) 3 : 7
(c) 3 :11
(d) 3 : 10
(e) None of these
Q13. Total employee who do not prefer any mode of vehicle from B is what percent less than employee who prefer cab from C?
(a) 44%
(b) 56%
(c) 60%
(d) 66%
(e) 64%
Q14. Find difference between total employee prefer cab & metro together & total employee do not prefer any mode of vehicle from D?
(a) 60
(b) 100
(c) 80
(d) 120
(e) 160
Q15. Total employee prefer cab from C is what percent of total employee prefer cab & metro together from D?
(a) 133 ⅓%
(b) 113 ⅓%
(c) 137 ⅓%
(d) 140 ⅓%
(e) 136 ⅓%
Solutions


 Quantitative Aptitude Quiz For Bank Main...
 Quantitative Aptitude Quiz For Bank Foun...


