

Directions (1-5): Study the line graph given below and answer the following questions based on it.
Line Graph given below shows total population of five different villages in 2019 and 2020 respectively.
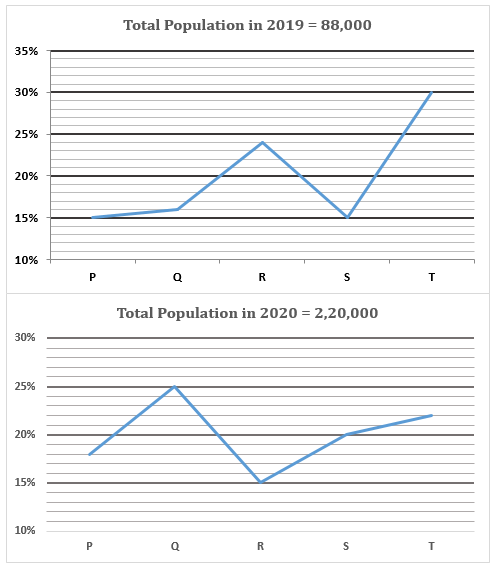
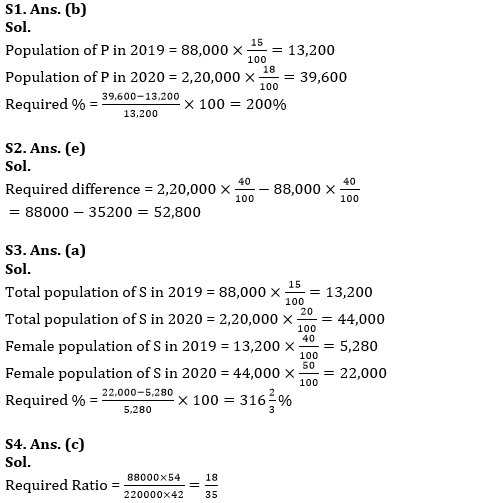
Q1. Find the percentage increase in population of P in 2020 as compare to 2019.
(a) 300%
(b) 200%
(c) 100%
(d) 150%
(e) 250%
Q2. Total population of R and Q in 2020 together is how much more than total population of same villages in 2019 together?
(a) 66,000
(b) 58,200
(c) 62,500
(d) 46,400
(e) 52,800
Q3. Out of total population of S in 2019, 60% are male while in 2020 it is 50%. Find the percentage increase in female population of S in 2020 as compare to 2019.
(a) 316⅔%
(b) 416⅔%
(c) 216⅔%
(d) 333⅔%
(e) 433⅔%
Q4. Find the ratio between total population of T and R in 2019 together to total population of S and T in 2020 together.
(a) 2 : 5
(b) 16 : 35
(c) 18 : 35
(d) 4 : 7
(e) 22 : 35
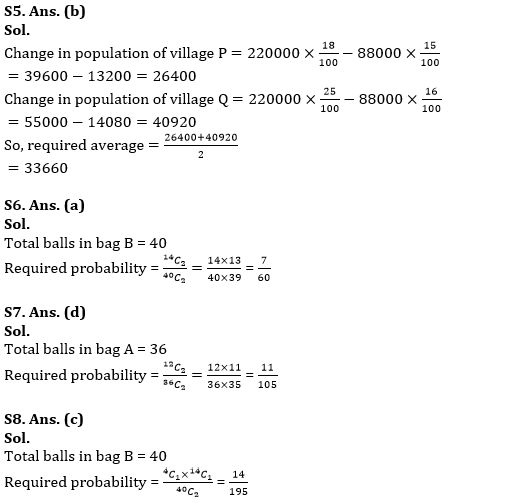
Q5. Find the average of number of population changed in village Q and P in 2020 from previous year.
(a) 28490
(b) 33660
(c) 25620
(d) 36360
(e) 42250
Directions (6 – 10): The given bar graph shows the number of balls of different colors in two different bags A and B. Read the data carefully and answer the following questions.
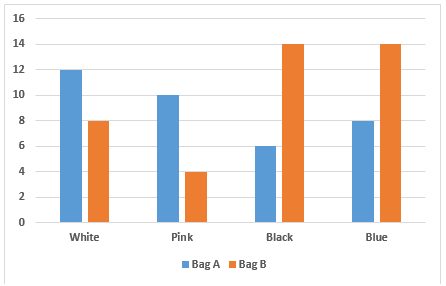
Q6. If two balls are drawn at random from bag B then what is the probability that both balls are blue in color?
(a) 7/60
(b) 13/80
(c) 9/40
(d) 5/53
(e) 7/120
Q7. If two balls are drawn at random from bag A then what is the probability that both are white in color?
(a) 15/101
(b) 22/105
(c) 10/104
(d) 11/105
(e) 9/106
Q8. If two balls are drawn at random from bag B then what is the probability that one is pink and one is black in color?
(a) 13/190
(b) 18/185
(c) 14/195
(d) 7/90
(e) 11/180
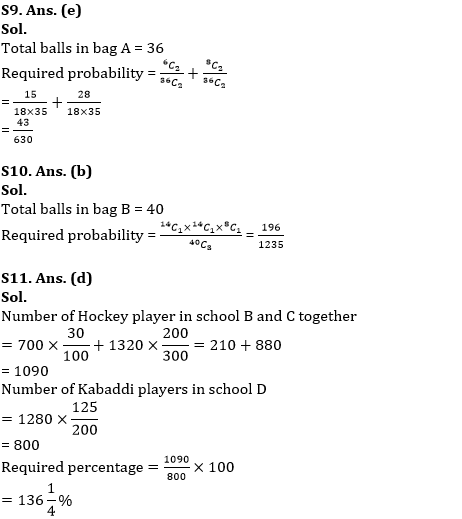
Q9. If two balls are drawn at random from bag A then what is probability that either both are black or both are blue in color?
(a) 22/315
(b) 1/14
(c) 1/15
(d) 27/610
(e) 43/630
Q10. If three balls are drawn at random from bag B then what is the probability that one is black, one is blue and one is white in color?
(a) 17/95
(b) 196/1235
(c) 88/1215
(d) 189/1135
(e) 163/965
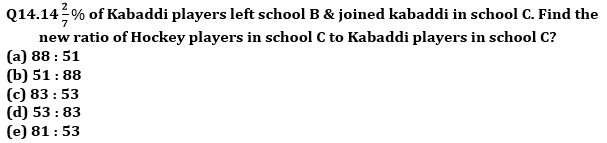
Directions (11-15): Table given below shows the total number of players in different schools and percentage of Kabaddi players in each Schools. Study the following table carefully and answer the questions based on it.
Note: There are only two games played in each Schools i.e., Kabaddi and Hockey and each player plays only one game
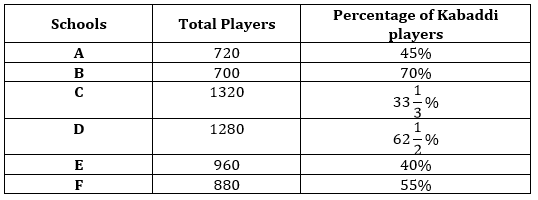
Q11. Number of Hockey players in school B and C together is what percent of the number of Kabaddi players in school D?
(a) 152%
(b) 147 ¼ %
(c) 132%
(d) 136 ¼ %
(e) 142 ⅔ %
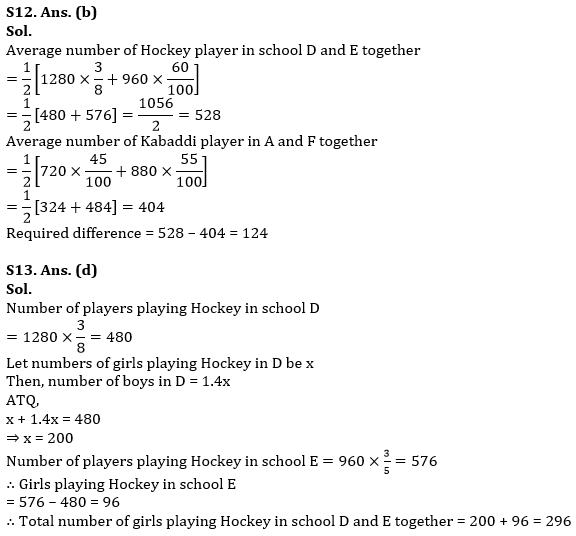
Q12. Average number of Hockey players in D and E schools together is how much more/less than the average number of Kabaddi players in A and F schools together?
(a) 108
(b) 124
(c) 144
(d) 136
(e) 168
Q13. Number of boys playing Hockey in school D is 40% more than the number of girls playing same game in same school & boys playing Hockey in school E is 480. Find total number of girls playing Hockey in school D and E together?
(a) 308
(b) 336
(c) 284
(d) 296
(e) 328
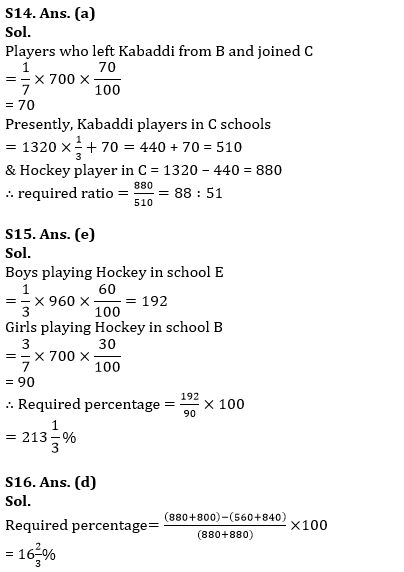
Q15. If ratio of boys to girls players in schools E playing Hockey is 1: 2 and ratio of girls to boys playing same game in school B is 3 : 4 then, boys playing Hockey in school E are what percent of girls playing Hockey in schools B?
(a) 207%
(b) 231⅓%
(c) 223%
(d) 217⅔%
(e) 213⅓%
Directions (16-20): The given bar graph shows the total number of employees in five different companies in two different years. Read the data carefully and answer the questions.
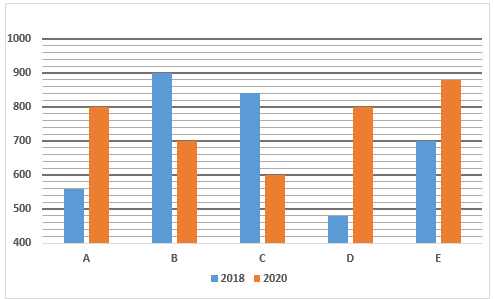
Q16. Total number of employees in company A and C together in year 2018 is what percent more or less than the total number of employees in company A and E together in year 2020.
(a) 25%
(b) 20%
(c) 13⅓%
(d) 16⅔%
(e) 15%
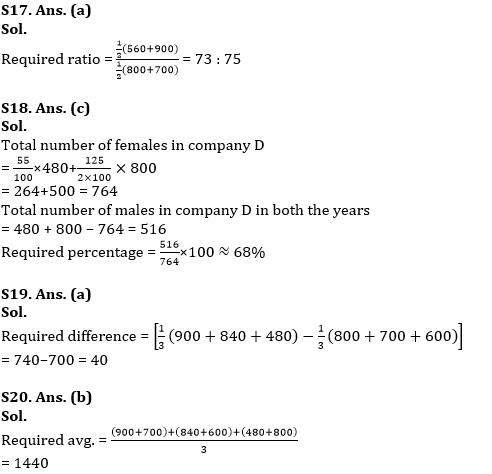
Q17. What is the ratio of average number of employee in company A and B together in year 2018 to average number employee in same company together in year 2020.
(a) 73 : 75
(b) 71 : 75
(c) 71 : 73
(d) 69 : 73
(e) 75 : 73
Q18. In company D, there are 55% females in year 2018 and 62 ½ % females in year 2020. Number of males in company D in both the year is approximately what percent of the total number of females in same company in both the year.
(a) 65%
(b) 60%
(c) 68%
(d) 72%
(e) 75%
Q19. Find the difference between the average of the number of employees in company A, B and C in year 2020 and the average of the number of employees in company B, C and D in year 2018.
(a) 40
(b) 60
(c) 50
(d) 30
(e) 20
Q20. Find the average of the number of employees in both the years in company B, C and D.
(a) 1360
(b) 1440
(c) 1500
(d) 1400
(e) 1300
Solutions

Click Here to Register for Bank Exams 2022 Preparation Material


 Puzzle Questions for SBI PO Exam
 LIC HFL Admit Card 2026 Out, Steps to Do...
 Daily Current Affairs and GK Updates (5t...


