

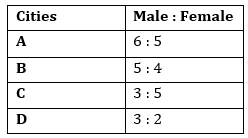
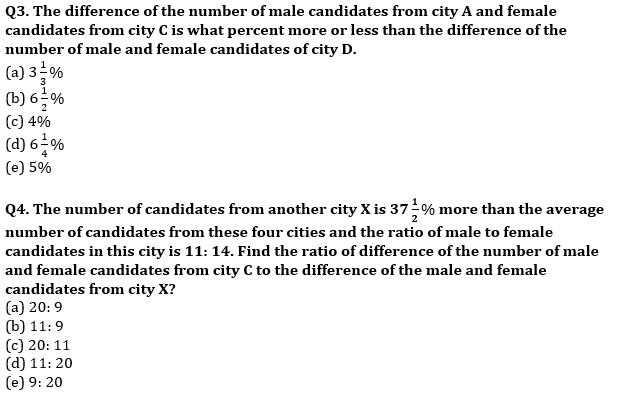
Directions (1-5): The given bar graph shows the total number of candidates who have applied for BANKING examination from four different cities and the table shows the ratio between number of male and female candidates. Read the data carefully and answer the following questions.
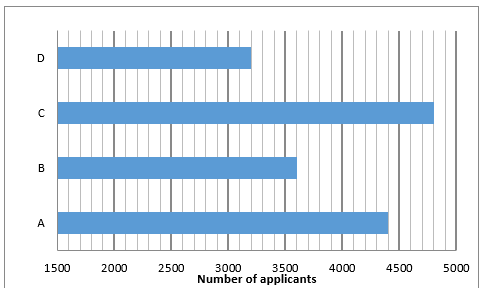
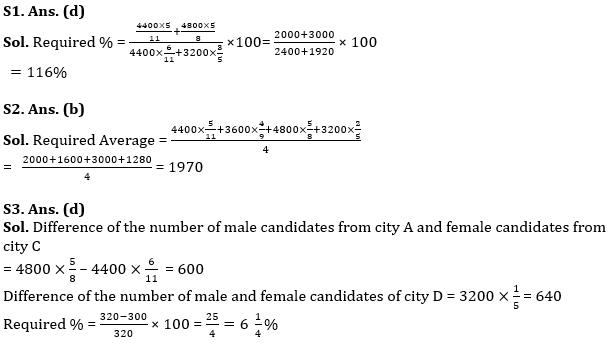
Q1. The number of female candidates from cities A and C together are approximately what percent of the total number of male candidates from cities A and D together?
(a) 110%
(b) 112%
(c) 108%
(d) 116%
(e) 120%
Q2. What is the average of all the female candidates from all the cities?
(a) 1930
(b) 1970
(c) 1990
(d) 2010
(e) 2030
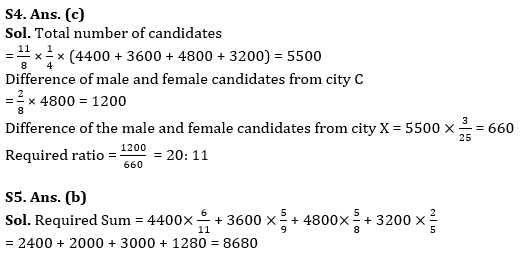
Q5. Find the sum of the total number of male candidates from city A and B and the number of female candidates from cities C and D?
(a) 8480
(b) 8680
(c) 8880
(d) 5080
(e) 5280
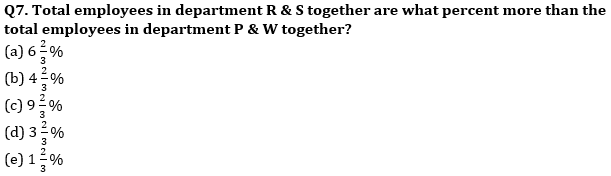
Directions (6-10): Read the data carefully and answer the questions.
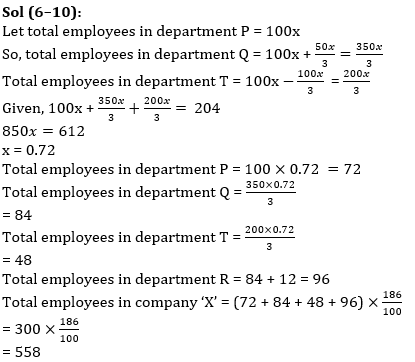
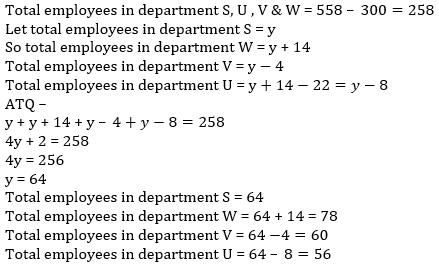
In a company ‘X’ there are 8 departments i.e. P to W. Total employees in department Q is 16⅔% more than the total employees in department P, while number of employees in department T is 33⅓% less than that of employees in department P. Total employees in department P, Q and T together is 204. Total employees in department R is 12 more than the total employees in department Q. Total employees in company ‘X’ is 86% more than the sum of employees in department P, Q, R & T together. Total employees in department W is 14 more than the total employees in department S, while total employees in department V is 4 less than the total employees in department S. Total employees in department U is 22 less than the total employees in department W.
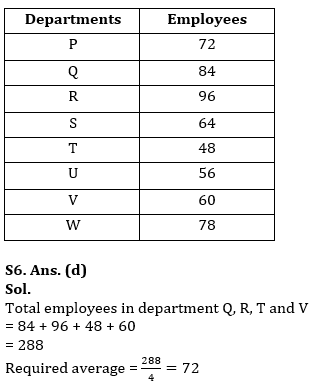
Q6. Find average of number of employees in department Q, R, T and V?
(a) 64
(b) 56
(c) 84
(d) 72
(e) 96
Q8. Find the ratio between total employees in department T & U together to total employees in R & V together?
(a) 2: 5
(b) 2: 7
(c) 2: 3
(d) 2: 9
(e) 2: 11
Q9. If total employees in department W of company ‘Y’ is 37½% more than the total employees in department R of company ‘X’, then total employees in department W of company ‘Y’ is what percent less than the total employees in department R & S together of company ‘X’?
(a) 12.5%
(b) 22.5%
(c) 20.5%
(d) 17.5%
(e) 15.5%
Q10. Find total number of employees in department P, R, T & V of company ‘X’?
(a) 256
(b) 276
(c) 284
(d) 302
(e) 316
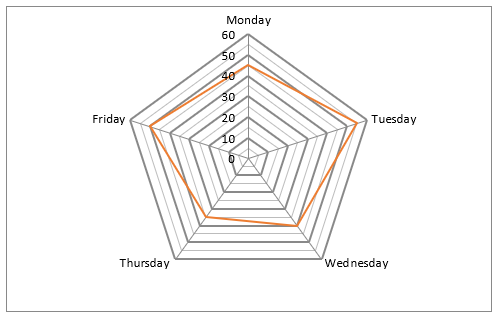
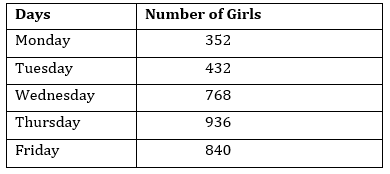
Directions (11-15): Given below radar graph shows boy percentage out of total students who come to visit museum on five different days of week in multiplex ‘XYZ’, while table shows number of girls come to visit museum on these five days of week. Read the data carefully and answer the questions.
Note – Total students come to visit museum = Boys come to visit museum + Girls come to visit museum.
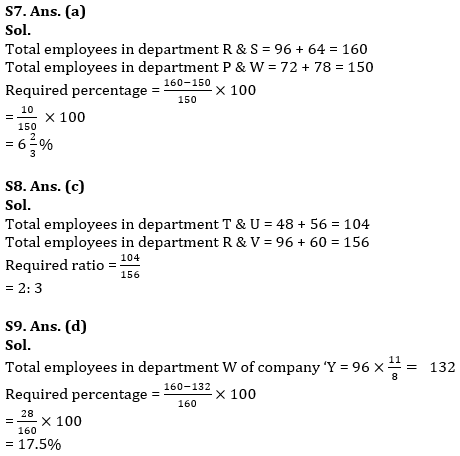
Q11. Total numbers of boys who visit museum on Friday is how much more than the total number of boys who visit museum on Tuesday.
(a) 316
(b) 328
(c) 344
(d) 312
(e) 356
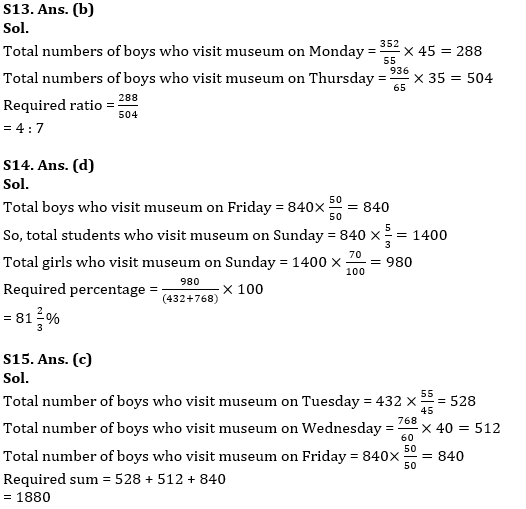
Q12. Total students who come to visit museum on Saturday is 25% more than that on Thursday and total girls who come to visit museum on Saturday is 37½% more than that on Tuesday, then find total boys who come to visit museum on Saturday?
(a) 1206
(b) 607
(c) 601
(d) 611
(e) 617
Q13. Find the ratio between total numbers of boys who visit museum on Monday to total numbers of boys who visit museum on Thursday.
(a) 4: 9
(b) 4: 7
(c) 4: 5
(d) 3: 7
(e) 3: 8
Q15. Find total number of boys who visit museum on Tuesday, Wednesday & Friday together.
(a) 1840
(b) 1920
(c) 1880
(d) 1920
(e) 1680
Directions (16-20): Given below pie chart shows percentage distribution of total Shoes manufactured by six companies in 2019. Read chart carefully and answer the question:
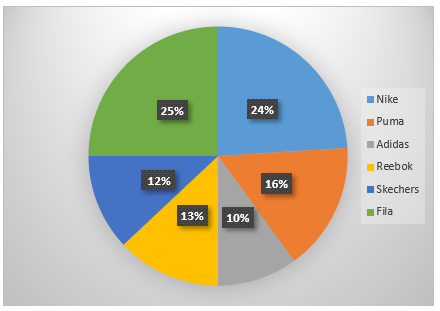
Note:
I. Ratio between total Shoes manufactured by these six companies in 2019 to total Shoes manufactured in 2020 is 4: 7
II. Percentage distribution for both the years remain same for all six companies.
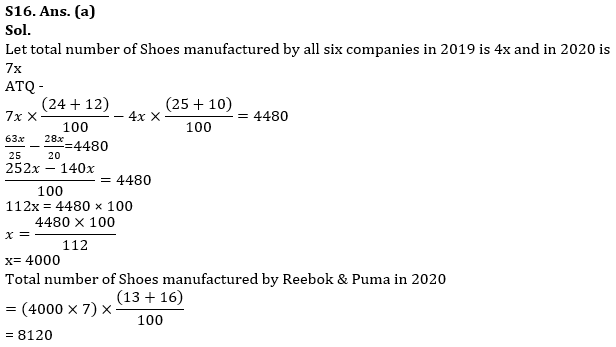
Q16. If difference between Shoes manufactured by Fila & Adidas together in 2019 and Shoes manufactured by Nike & Skechers together in 2020 is 4480 then find total number of Shoes manufactured by Reebok & Puma in 2020?
(a) 8120
(b) 8020
(c) 8220
(d) 8320
(e) 8420
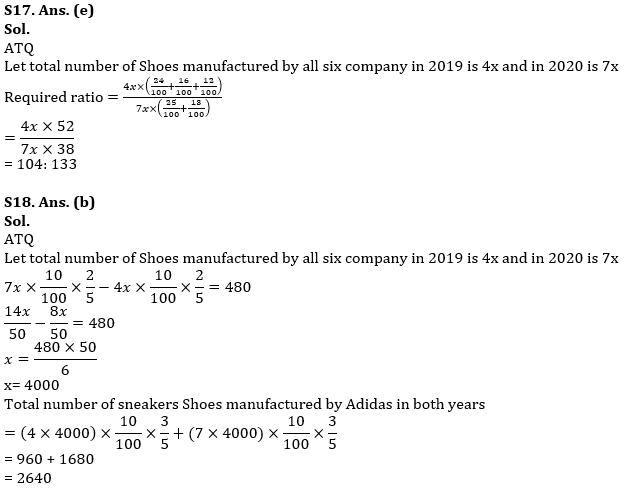
Q17. Find the ratio between total number of Shoes manufactured by Nike, Puma and Skechers together in 2019 to total number of Shoes manufactured by Fila & Reebok in 2020?
(a) 127: 133
(b) 133: 103
(c) 103: 133
(d) 133: 104
(e) 104: 133
Q18. If ratio between sports Shoes to sneakers Shoes manufactured by Adidas is 2: 3 for both the years and difference between sports Shoes manufactured by Adidas in both the years is 480. Find total number of sneakers Shoes manufactured by Adidas in both year?
(a) 2540
(b) 2640
(c) 2620
(d) 2720
(e) 2820
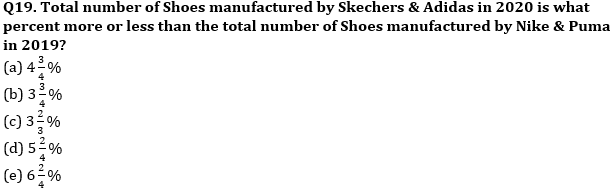
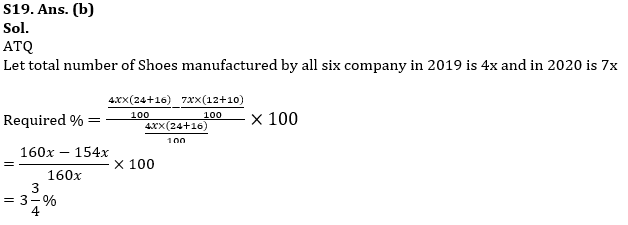
Q20. If total Shoes manufactured by Nike and Puma in 2020 is 11200. Find the average number of Shoes manufactured by Fila, Adidas and Reebok in 2019?
(a) 2520
(b) 2540
(c) 2560
(d) 2580
(e) 3060
Solutions


 80 Most Important General Awareness Ques...
 Daily Current Affairs and GK Updates (3r...
 IB ACIO Cut Off 2026, Check Previous Yea...


