The BOB Office Assistant exam is coming up soon, so candidates need to pay special attention to the main topics. Data Interpretation (D.I.) is one of the key sections in the exam, and it is always important. To help you prepare better, we have created a set of Data Interpretation questions for the BOB Office Assistant exam, along with clear step-by-step answers. Practicing these will help you get better at solving problems and feel more confident for the exam
Data Interpretation Questions for BOB Office Assistant
To help you do well in the BOB Office Assistant 2025 exam, we have included some Data Interpretation questions. These questions are the same as those you will see in real bank exams. They are here to help you learn about different ways data can be shown and to help you do your calculations faster. If you become good at Data Interpretation, your exam score will go up and you’ll have a better chance of doing well overall.
Importance of Data Interpretation Questions
Data Interpretation (DI) questions are important in the BOB Office Assistant exam, especially within the Quant section. These questions test your ability to understand and analyze data presented in various formats such as bar graphs, tables, charts, and sometimes pie charts or line graphs. Regular practice of DI questions increases your speed and accuracy, which is crucial given the strict time limits only 20 minutes per section and the negative marking for wrong answers.
Direction (1-5): The table shows the number of employees in five companies.
| Companies | Total employees |
| A | 33.33% of 72 |
| B | 12.5% of 80 |
| C | 9.09% of 330 |
| D | 25% of 124 |
| E | 11.11% of 90 |
Q1. Average number of employees in B and E.
(a) 10
(b) 9
(c) 12
(d) 11
(e) 18
Q2. Ratio of employees in A to B and C together.
(a) 2:3
(b) 3: 4
(c) 3: 5
(d) 4: 1
(e) 1: 2
Q3. Sum of employees in all the companies.
(a) 105
(b) 109
(c) 102
(d) 101
(e) 108
Q4. Employees in C is what percentage of employees in A and D together.
(a) 65.65%
(b) 54.54%
(c) 55%
(d) 17%
(e) 15%
Q5. In F, total employees are 100% more than sum of employees in A and C. find the total employees in F.
(a) 108
(b) 195
(c) 105
(d) 55
(e) 103
Direction (6-10): The graph shows the number of pizza and burger sold by five shopkeepers.
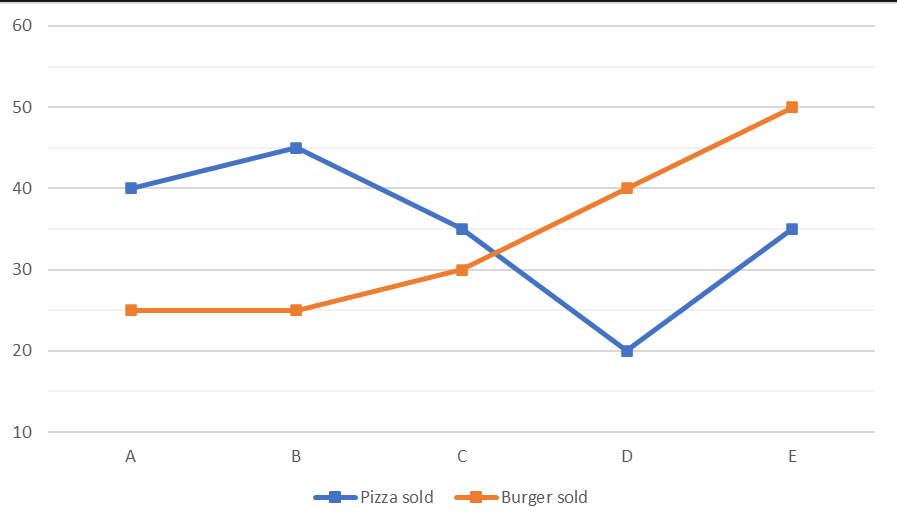
Q6. Pizza sold by A is what percentage of Pizza and burger sold by D?
(a) 60%
(b) 33.33%
(c) 66.66%
(d) 90%
(e) 65%
Q7. Sum of Burger sold by A and B.
(a) 80
(b) 100
(c) 60
(d) 50
(e) 20
Q8. Find 40% of burger sold by E and 20% of Pizza sold by A.
(a) 28
(b) 14
(c) 24
(d) 40
(e) 44
Q9. Find the ratio of burger sold by D and C together to pizza sold by C and E together.
(a) 1: 1
(b) 2: 3
(c) 3: 1
(d) 1: 3
(e) 3: 2
Q10. Shop F sold 20 more pizza than A and 15 less burgers than A. Find the pizza and burger sold by F.
(a) 70
(b) 80
(c) 20
(d) 100
(e) 25
| Answer Key | |
| Q.No. | Answer |
| 1 | (a) |
| 2 | (c) |
| 3 | (a) |
| 4 | (b) |
| 5 | (a) |
| 6 | (c) |
| 7 | (d) |
| 8 | (a) |
| 9 | (a) |
| 10 | (a) |


 Daily Current Affairs Quiz 3rd April, 20...
 RBI Assistant Admit Card 2026 Out at rbi...
 Exim Bank Management Trainee Admit Card ...