|
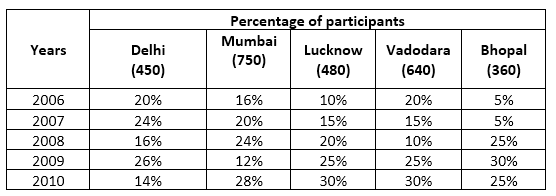
Q1. How many participants are selected in DID in 2007 from all the cities together?
(a) 333
(b) 444
(c) 344
(d) 544
(e) 555
Q2. No. of participants selected from Mumbai in the year 2006 is what percent more or less than that from Vadodara in the same year?
(a) 6.5% more
(b) 6.25% more
(c) 6.25% less
(d) 6.5% less
(e) 8.25% more
Q3. What is the average no. of participants in the year 2008 from all the cities together who get selected in DID? (approximately)
(a) 110
(b) 95
(c) 105
(d) 100
(e) 80
Q4. What is the ratio of participants selected from Lucknow in 2009 and 2010 together to that selected from Bhopal in the years 2009 and 2010 together?
(a) 3 : 4
(b) 4 : 3
(c) 2 : 3
(d) 3 : 2
(e) 5 : 4
Q5. If in 2005, the no. of selected participants from Delhi and Mumbai were 20% and 40% less than that in 2006 respectively then find the difference between selected participants of Delhi and Mumbai in the year 2005?
(a) 8
(b) 20
(c) 16
(d) 4
(e) 0
Directions (6 – 10): The Graph shows the number of houses to be constructed in various states over the Years Under Pradhan Mantri Awas Yojna. Study the following graph carefully and answer the questions given below.
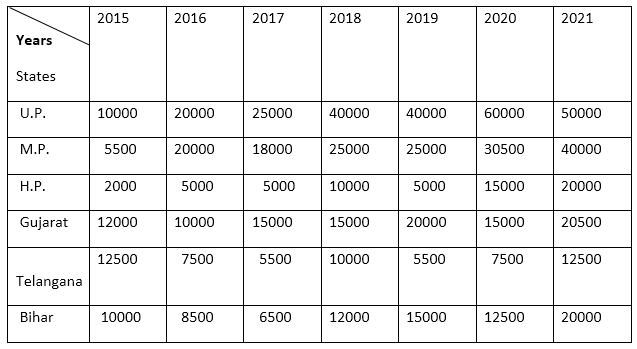
Q6. The total number of houses to be constructed across the states in the year 2016 are approximately what percent of the total number of houses to be constructed across the State in the year 2021?
(a) 40 %
(b) 44 %
(c) 35 %
(d) 49 %
(e) 39 %
Q7. What is the difference between the total number of houses to be constructed in the year 2018 and the year 2021 across all states?
(a) 41,000
(b) 51,500
(c) 50,000
(d) 51,000
(e) 61,000
Q8. Which among the following states has to construct maximum houses in all the given years together?
(a) HP
(b) MP
(c) Telangana
(d) Bihar
(e) UP
Q9. If the 60 % of the number of houses to be constructed in 2016 in U.P. would be rescheduled for next year and added to the next year’s tally then, now what is the ratio of houses to be constructed in 2016 to houses to be constructed in 2017 in UP?
(a) 9 : 37
(b) 7 : 37
(c) 8 : 37
(d) 17 : 43
(e) None of the above
Q10. Total houses to be constructed in Gujarat over all year is what percent more/less than total houses to be constructed in H.P. over all the years?
(a) 73.4%
(b) 70 %
(c) 78 %
(d) 63.4%
(e) 82%
Directions (11-15): Given below is the table which shows the number of students in seven institutes over different years. Study the following table carefully and answer the questions given below it.
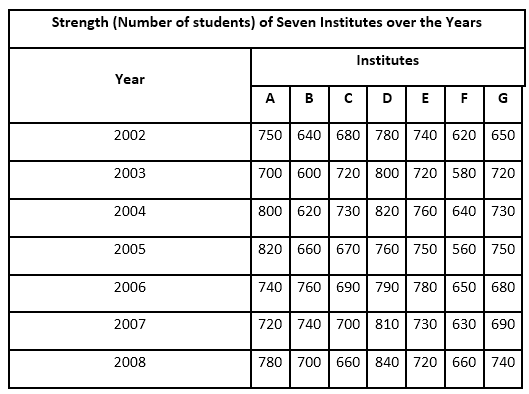
Q11. In year 2005, ratio of male to female students from both institutes A and G was same i.e. 7 : 3. What will be the new percentage of females in institute G if 50% of the females and 50% of males from institute A were transferred to institute G?
(a) 30%
(b) 32.36%
(c) 35%
(d) 38.71%
(e) 42.35%
Q12. If in 2008, overall 60% students passed from all the institutes then, no. of passed students in 2008 is what percent of average no. of students from all the institutes in 2006 (approximately).
(a) 450%
(b) 421%
(c) 470%
(d) 390%
(e) 380%
Q13. In year 2003, the ratio of passed students to failed students from institute C was 4: 5. If the no. of male and female students for the same institute in year 2003 was 11 : 7 then, find the ratio of students failed to no. of females in institute C in 2003?
(a) 8 : 3
(b) 7 : 11
(c) 10 : 7
(d) 12 : 11
(e) 11: 12
Q14. If in 2007, 20% of students from institutes D and 40% of students from institute E were selected for an inter-college competition, then what percent of the students from both the college were selected for the competition? (approximately)
(a) 20%
(b) 23%
(c) 26%
(d) 29%
(e) 17%
Q15. The average no. of students in institute F over all the years is what percent more/less than the average no. of students in year 2008 for all the institutes? (approximately)
(a) 12%
(b) 19%
(c) 15%
(d) 18%
(e) 7%


 Quantitative Aptitude Quiz For IDBI AM/E...
 Quantitative Aptitude Quiz For IBPS RRB ...