Dear Aspirants,
 |
|
Quantitative Aptitude for IBPS Clerk Mains 2017
|
Quantitative Aptitude Section has always given heebie-jeebies to the aspirants whenever they appeared for a banking examination. As the level of every other section is has only got complex and convoluted, there is no doubt that this section, too, makes your blood run cold. The questions asked in this section are calculative and very time-consuming. But once dealt with proper strategy, speed and accuracy, this section can get you the maximum marks in the examination. Following is the quiz on Quantitative Aptitude (Data Interpretation) to help you practice with the best of latest pattern questions.
Directions (1-5): Study the following table carefully to answer the questions that follow–

Q1. If the profit earned by Company C in the year 2014 was Rs. 18.9 lakhs, what was the income of company C in that year?
(a) Rs. 303.7 lakhs
(b) Rs. 264.5 lakhs
(c) Rs. 329.4 lakhs
(d) Rs. 228.9 lakhs
(e) Rs. 218.9 lakhs
Q2. What is the percentage rise in profit of Company E in year 2015 from the year 2010?
(a) 40
(b) 35
(c) 26
(d) 48
(e) 38
Q3. If the profit earned by Company A in the year 2013 was Rs. 2.1 lakhs, what was the expenditure in that year?
(a) Rs. 30 lakhs
(b) Rs. 15 lakhs
(c) Rs. 23 lakhs
(d) Rs. 27 lakhs
(e) Rs. 25 lakhs
Q4. What was the average per cent profit of Company D over all the years together?
(a) 13.5
(b) 11
(c) 12
(d) 14
(e) 10
Q5. What is the difference between the per cent profit earned by Company B in the year 2011 and the average per cent profit earned by the remaining Companies together in that year?
(a) 4
(b) 2
(c) 1
(d) 3
(e) 5
Directions (Q.6-10): The following line graph gives the annual percent profit earned by two traders during the period 2012-2017. Study the graph and answer the questions based on it.
Percent profit earned by two traders over the years
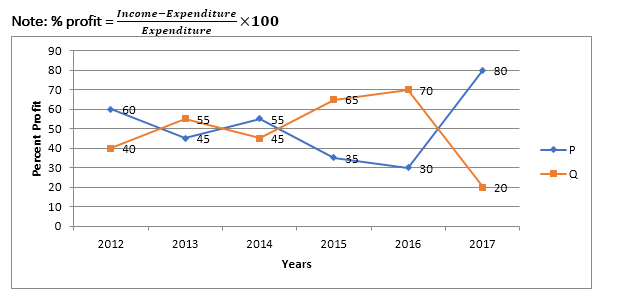
Q6. What is the average profit percent earned by P and Q throughout the years?
(a) 54%
(b) 50%
(c) 50.5%
(d) 51%
(e) 48.5%
Q7. If in year 2014, the expenditure made by P was Rs. 5 lakhs, then what was the income in that year?
(a) Rs. 7,57,000
(b) Rs. 7,75,500
(c) Rs. 7,75,000
(d) Rs. 7,50,000
(e) Rs. 5,75,000
Q8. If in year 2016 the income of P and Q was Rs. 18.85 lakhs and Rs. 22.78 lakhs respectively, the expenditure of Q was by about what percent more or less than the expenditure of P in that year?
(a) 8% more
(b) 8% less
(c) 6% more
(d) 6% less
(e) 10% more
Q9. If the income of Q remains same throughout the years i.e Rs. 4.2 lakhs then in which year his expenditure was minimum and what was the expenditure in that year?
(a) 2017, Rs. 2.24 lakhs
(b) 2016, Rs. 2.47 lakhs
(c) 2017, Rs. 2.0 lakhs
(d) 2017, Rs. 2.89 lakhs
(e) 2015, Rs. 3.45 lakhs
Q10. In which year the ratio of profit percent of P to Q has the maximum numeric value?
(a) 2013
(b) 2012
(c) 2015
(d) 2016
(e) 2017
Directions (Q11-15): Study the following pie chart and answer the following question given below:
Total Number of male in the organization is two times of the total number of females in the organization–

Q11. Number of males in Marketing, Technical and IT department together are approximately what percent more or less than the total number of females in the same departments?
(a) 98%
(b) 102%
(c) 105%
(d) 107%
(e) 108%
Q12. Out of the total number of employees from Administrative department, 30% of the employees got promoted. then find the ratio of the number of employees from Administrative department who get promoted to the total number of female employees in the organization ?
(a) 30600 : 879
(b) 5300 : 329
(c) 5100 : 293
(d) 293 : 5100
(e) 879 : 5100
Q13. If one male from Daily working department can do a work in 21420 days and the female from Daily working department are 20% less efficient than that of male in Daily working department.then Find the total no. of days taken by all employees from Daily working department to do the same job ?
(a) 2002/2009 days
(b) 2002/1096 days
(c) 485/714 days
(d) 714/485 days
(e) 814/485 days
Q14. Find the difference between the average number of males in all departments of the organization and the average number of females in all departments of the organization ?
(a) 3060
(b) 2440
(c) 2630
(d) 2920
(e) 2290
Q15. If in the IT department some male employees are increased such that the total no. of male employees in IT department becomes 70% more than the total no. of female employees in Daily working department. then the total no. of male employees now in IT department is approximately what percent of total no. of employees in Administrative department ?
(a) 287.5%
(b) 278.5%
(c) 258.7%
(d) 280%
(e) 281.5%


You may also like to Read:
- Quantitative Questions for upcoming Banking and Insurance Examinations
- Study Notes of Quantitative Aptitude
- Practice More Data Interpretation Questions
- Quantitative Aptitude Section Strategy

 Quantitative Aptitude Quiz For IDBI AM/E...
 Quantitative Aptitude Quiz For IBPS RRB ...