

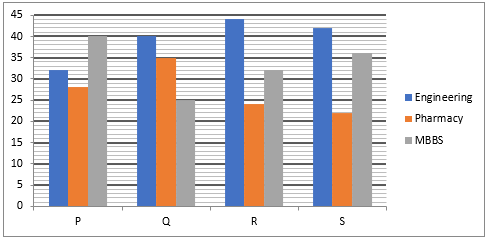
Directions (1-5):- Given bar graph shows the percentage distribution of total number of students of each school (P, Q, R & S) who took admission in 3 different streams. Total students in P, Q, R & S are 700, 800, 400 & 900 respectively.
Quantitative Quiz For IBPS Clerk Prelims 2022 19th July in HINDI
Q1. What is average number of students who have opted for MBBS in all the 4 colleges?
(a) 256
(b) 233
(c) 284
(d) 224
(e) 296
Q2. What is the ratio of the total number of student who have opted for both engg. and MBBS stream together in college Q to that of in same stream together in college R?
(a) 38:65
(b) 67:35
(c) 35:67
(d) 65:38
(e) 29:37
Q3. The number of students who have opted for MBBS in college P is what percent of the number of students who have opted for the engg. in college Q?
(a) 87.5%
(b) 50%
(c) 75%
(d) 100%
(e) 62.5%
Q4.What is the ratio of the no. of students who have opted for engg. in college R to that of those who have opted for same stream in college P?
(a) 14:11
(b) 17:13
(c) 11:14
(d) 13:17
(e) None of these
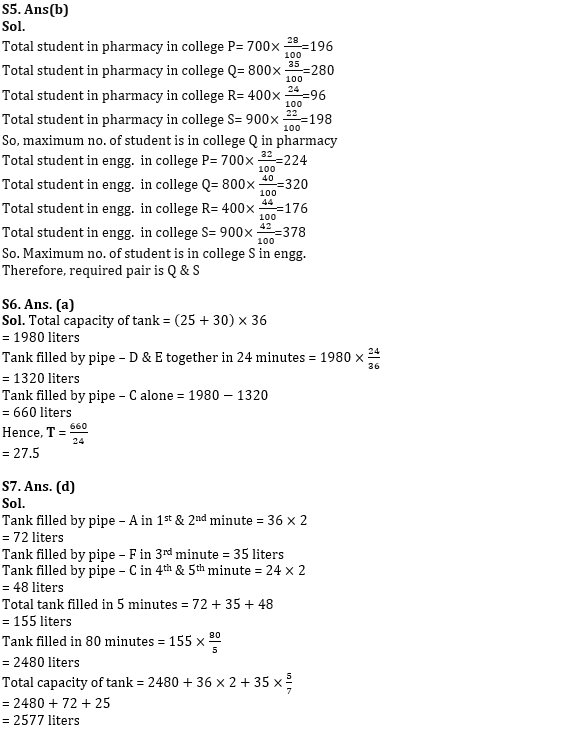
Q5. Which of the combination represents the colleges with maximum number of students, who have opted for pharmacy and those who have opted for engg. respectively?
(a) P & R
(b) Q & S
(c) Q & R
(d) R & S
(e) P & Q
Directions (6-10): Study the bar chart given below and answer the following questions.
The bar chart shows the efficiencies (in liters/minute) of 6 different pipes (A, B, C, D, E & F).
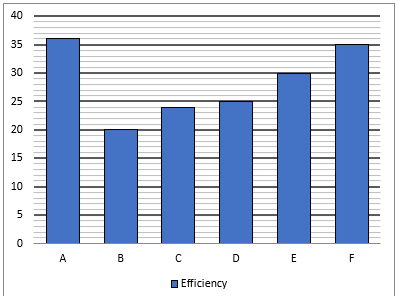 Q6. Pipe – D & E together can fill a tank in 36 minutes. Pipe – C alone starts filling the same tank and after T minutes, pipe – D & E together replaced it. If pipe – D & E together filled the remaining tank in 24 minutes, then find T.
(a) 27.5
(b) 25
(c) 30
(d) 32.5
(e) 22.5
Q7. Pipe – A, C & F starts filling a tank in such a way that pipe – A filled the tank in 1st and 2nd minute, then pipe – F filled the tank in 3rd minute and then pipe – C filled the tank in 4th & 5th minute. If the tank is completely filled in ![]() minutes, then find the total capacity of the tank.
minutes, then find the total capacity of the tank.
(a) 2553 liters
(b) 2560 liters
(c) 2592 liters
(d) 2577 liters
(e) None of the above.
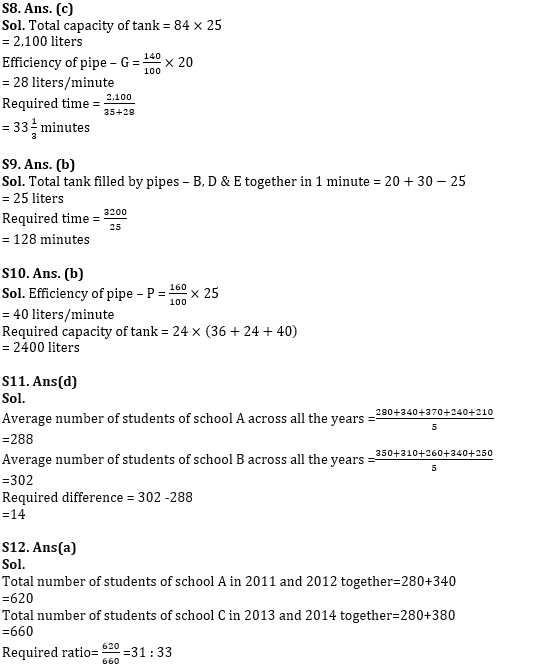
Q8. If pipe – D alone can fill a tank in 84 minutes and pipe – G is 40% more efficient than pipe – B, then find the time taken by pipe – F & G together to fill the same tank.
(a) 80 minutes
(b) 72 minutes
(c) 33⅓ minutes
(d) 60 minutes
(e) 66⅔ minutes
Q9. If the total capacity of a tank is 3200 liters and pipes – B, D & E are attached to it. Pipe – B & E are filling pipes and pipe – D is an emptying pipe. If all three pipes are opened together in the tank, then in how much time the tank will be completely filled?
(a) 120 minutes
(b) 128 minutes
(c) 112 minutes
(d) 136 minutes
(e) 148 minutes
Q10. If pipes – A, C & P together can fill the tank in 24 minutes and efficiency of pipe – P is 60% more than the efficiency of pipe – D, then find the total capacity of the tank?
(a) 2000 liters
(b) 2400 liters
(c) 1800 liters
(d) 2500 liters
(e) 3000 liters
Directions (11-15):- Given bar graph shows the details of number of students in a particular class of 3 different schools in 5 different years.
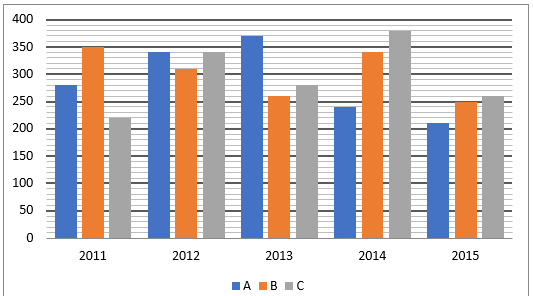
Q11.What is the difference between average number of students of school A across all the years and the average number of students of school B across all the years?
(a) 18
(b) 10
(c) 12
(d) 14
(e) 16
Q12.Find the respective ratio of the total number of students of school A in 2011 and 2012 together to the total number of students of school C in 2013 and 2014 together?
(a) 31:33
(b) 47:55
(c) 55:47
(d) 33:31
(e) 31:37
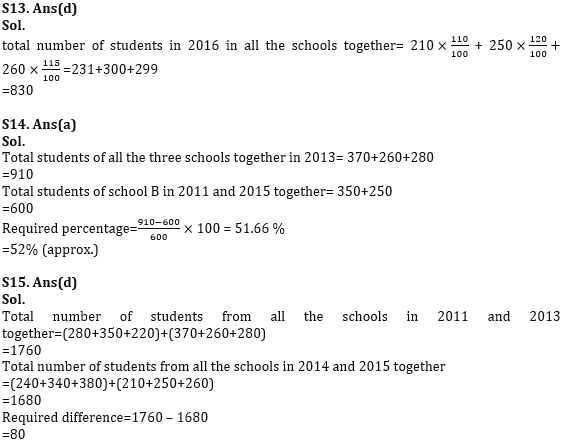
Q13.If in 2016, the total number of students in School A, School B and School C increases by 10%,20% and 15% respectively as compared to 2015, then find the total number of students in 2016 in all the schools together?
(a) 850
(b) 870
(c) 780
(d) 830
(e) 800
Q14.Total students of all the school together in 2013 is approximately what percentage more/less than the total students of school B in 2011 and 2015 together?
(a) 52%
(b) 59%
(c) 56%
(d) 63%
(e) 48%
Q15.Find the difference between the number of total students from all the schools in 2011 and 2013 together and the total number of students from all the schools in 2014 and 2015 together?
(a) 140
(b) 60
(c) 120
(d) 80
(e) 100
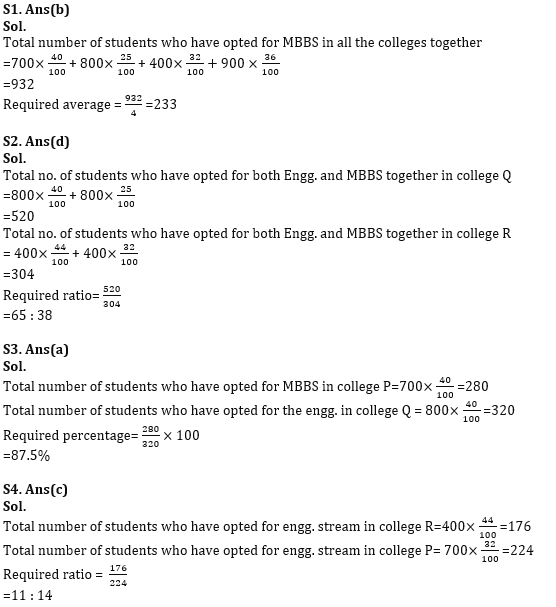
Solutions


 Daily Current Affairs and GK Updates (2n...
 DSSSB IT Assistant Syllabus and Exam Pat...
 RBI Assistant Score Card 2026, Download ...


