

Directions (1–5): Pie chart (i) given below show percentage distribution of total (students + teacher) in five schools and pie chart (ii) shows percentage distribution of total boys in these five schools. Read the data carefully and answer the questions given below.
![]()
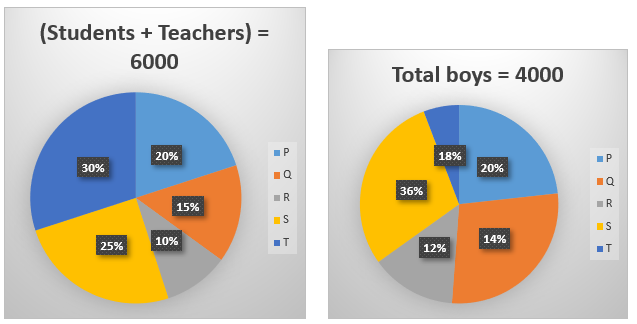
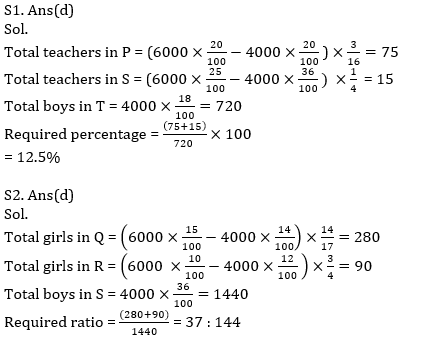
Q1. If ratio of teachers to girls in P & S is 3 : 13 and 1 : 3 respectively, then find total teachers in P & S together is what percent of total boys in T?
(a) 8.33%
(b) 16%
(c) 12%
(d) 12.5%
(e) 6.66%
Q2. If ratio of teachers to girls in Q is 3 : 14 and total girls are two times more than teachers in R, then find ratio of total girls in Q & R together to total boys in S?
(a) 37 : 147
(b) 37 : 142
(c) 37 : 150
(d) 37: 144
(e) 37 : 156
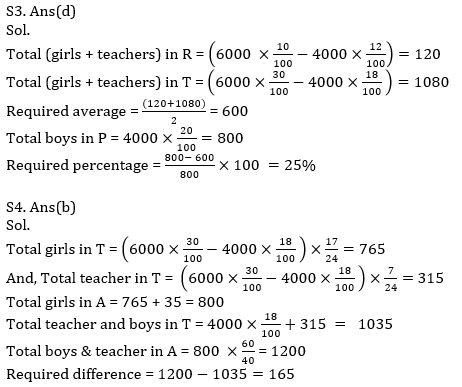
Q3. Find average number of (girls + teachers) in R & T is what percent less than total boys in P?
(a) 40%
(b) 30%
(c) 20%
(d) 25%
(e) 45%
Q4. The ratio of girls to teacher in T is 17 : 7 and total girls in school A is 35 more than that of in T. If total girls in A is 40% of total people in that school, then find difference between (boys + teacher) in T and A?
(a) 100
(b) 165
(c) 125
(d) 115
(e) None of these
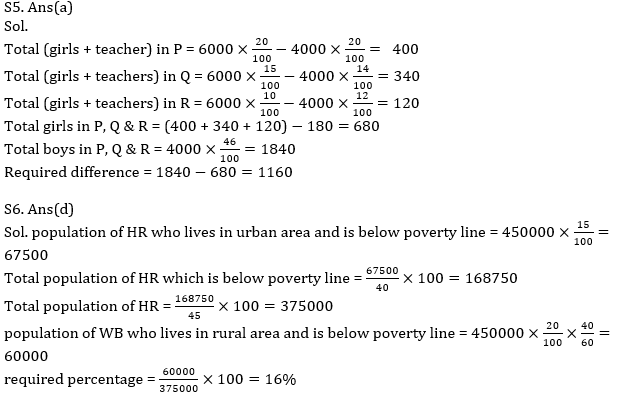
Q5. If in P, Q and R total teachers are 180, then find total girls in these three schools are how much less than total boys in these three schools?
(a) 1160
(b) 1190
(c) 1140
(d) 1120
(e) 1100
Directions (6-10): Pie chart given below gives information about percentage of people who are below poverty line and live in urban area of five different states i.e. MP, UP, RJ, HR and WB. In MP, RJ and WB, 60% of total population who are below poverty line lives in urban area while in HR and UP, 60% of total population who are below poverty line lives in rural area. Total population of these five states which is below poverty line and lives in urban area is 4.5 lakh.
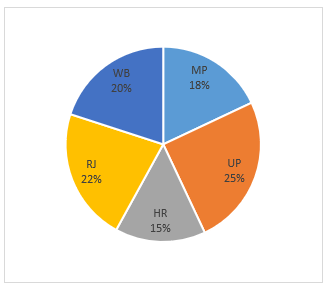
Q6. If 45% of Total population of HR is below poverty line. Then find no. of people who are below poverty line and live in rural area in WB is what percent of total population of HR.
(a) 10%
(b) 22%
(c) 12%
(d) 16%
(e) 18%
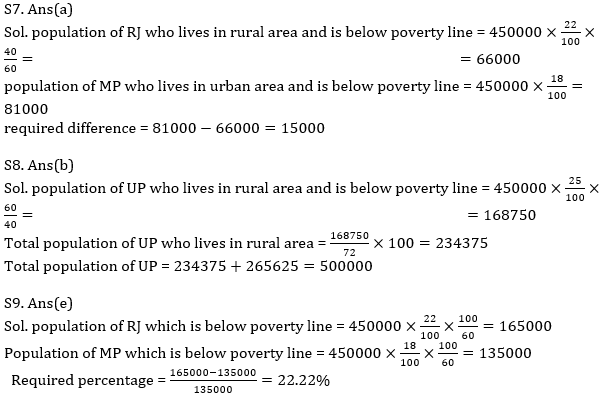
Q7. Find difference between population of RJ who lives in rural area and is below poverty line and population of MP who is below poverty line and lives in Urban area.
(a) 15000
(b) 17000
(c) 28000
(d) 25000
(e) 27000
Q8. If in UP 72% of rural population is below poverty line and total 2,65,625 people lives in urban area, then find total population of UP.
(a) 400000
(b) 500000
(c) 300000
(d) 800000
(e) 700000
Q9. Total no. of people who are below poverty line in RJ are how much percent more or less than that of MP.
(a) 11.11%
(b) 12.5%
(c) 9.09%
(d) 9.99%
(e) 22.22%
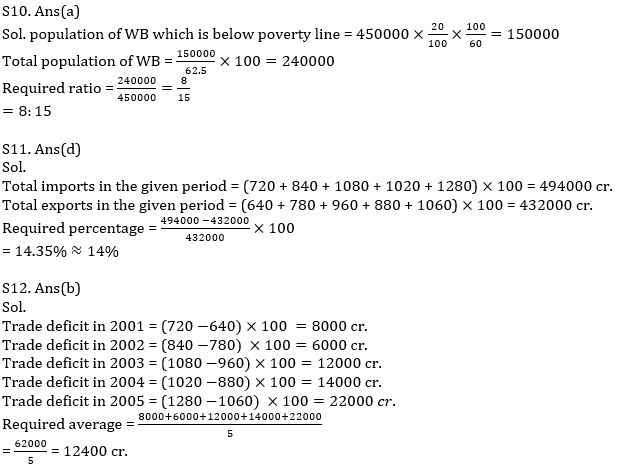
Q10. If 37.5% population of WB is above poverty line, then find ratio of total population of WB to total people who are below poverty line and living in urban area in all five states.
(a) 8:15
(b) 2:3
(c) 1:5
(d) 13:15
(e) 3:5
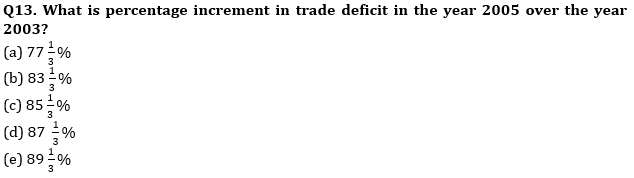
Directions (11 -15): Given below bar graph shows Import (in hundred cr.) and export (in hundred cr.) of India to China during 2001 -2005. Read the data carefully and answer the questions.
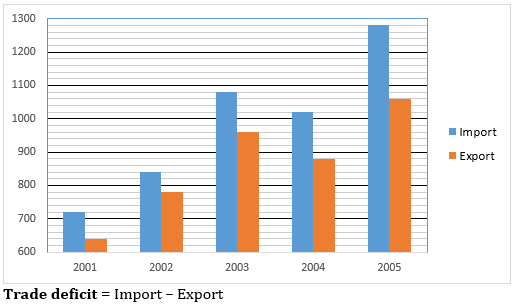
Q11. The total imports are approximately what percent more than total exports in the given period?
(a) 18%
(b) 8%
(c) 20%
(d) 14%
(e) 24%
Q12. Find the average of trade deficit in the given period?
(a) 12000 cr.
(b) 12400 cr.
(c) 12800 cr.
(d) 14400 cr.
(e) 13600 cr.
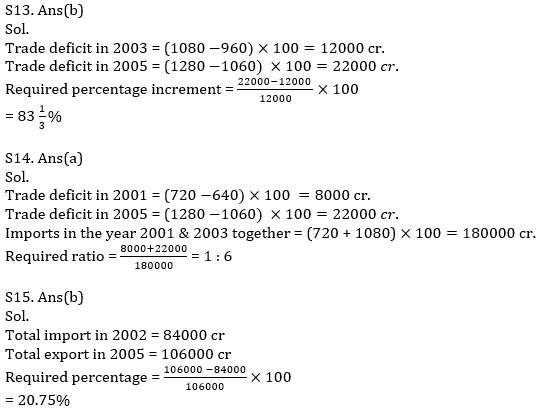
Q14. Find the ratio of trade deficit in the year 2001 & 2005 together to Imports in the year 2001 & 2003 together?
(a) 1 : 6
(b) 1 : 5
(c) 3 : 5
(d) 1 : 4
(e) 1 : 7
Q15. Total import in the year 2002 is what percent less than total export in the year 2005?
(a) 16.75%
(b) 20.75%
(c) 24.75%
(d) 28.75%
(e) 32.75%
Solutions

Click Here to Register for Bank Exams 2021 Preparation Material


 Daily Current Affairs Quiz 7th June 2026...
 World Food Safety Day 2026, Theme, Histo...
 Daily Current Affairs and GK Updates (6t...


