

Quantitative Aptitude Quiz For SBI PO/Clerk Prelims
Directions (1-5): Study the following graphs and answer the given questions.
Given below is the bar graph showing the production of mouse by 6 companies, LOGITECH, HP, DELL, ACER, HCL and LENOVO in two consecutive years 2015 and in 2016.

Q1. What is the difference between average production of mouse by HP for both year and LENOVO for both year?

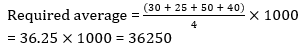
Q2. What is the average of sum of mouse production by companies LOGITECH in 2015, HCL in 2016 and ACER in 2016 ?
Q3. If production of mouse of company Acer in 2017 increases by 20% in comparison to previous year and production of mouse by company HCL in 2017 increases by 25% in comparison to previous year then what is the sum of production of mouse in 2017 for firm ACER and HCL together?
Q4. What is the ratio of production of mouse by company LOGITECH in 2015 and LENOVO in 2015 together to the production of HCL in 2016 and ACER in 2016 together?

Q5. Production of mouse for company HP in both years is what % more or less than production of mouse for company DELL in 2016 and company HCL in 2015 together. (approximately)
Q6. A bag contains 510 oranges out of which 70/17% oranges are spoiled by a naughty boy. Find the probability of getting a good orange from the bag.
Q7. 3 unbiased coins are tossed. Find the probability of getting exactly two ‘Heads’.

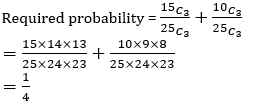
Q8. In a class, there are 15 girls and 10 boys. Three students are selected at random. The probability that only girls or only boys get selected is:
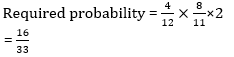
Q9. A bag has twelve bananas out of which four are rotten. Two bananas are selected at random. Find the probability that the bananas are of both types.
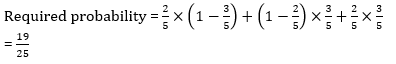
Q10. The probability of Sharmila and Shushma passing an exam is 2/5 and 3/5, respectively. Find the probability that at least one of them passes the exam.
Directions (11-15): Study the following graph carefully and answer the questions given below.
Given bar graph shows the number of two types of TV sets (Type X and Type Y) sold over 6 years

Q11. What was the average number of Y-type TV sets sold by the company in 2011, 2012, 2014 and 2015 together?
Q12. The number of X-type TV sets sold in 2011 was exactly what percent of the number of Y-type TV sets sold in 2015?
Q13. What is the percentage increase in the sale of Y-type TV sets from 2011 to 2014?
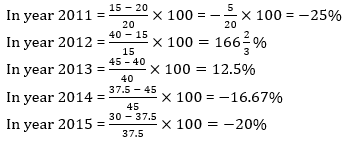
Q14. In which of the following years was the percentage increase/decrease of sale of X-type TV sets the maximum from the previous year?
Q15. In which of the following years was the difference between the sales of X-type TV sets and Y-type TV sets the minimum?


 SBI Clerk and IBPS Clerk Notifications E...
 Daily Current Affairs Quiz 26th July 202...
 Adda247’s Digital Classrooms Delivered...


