
The IBPS RRB exam is approaching, and candidates must focus on strengthening the crucial sections to ensure a solid performance. One of the most vital and high-scoring parts of the paper is Data Interpretation (D.I.), which tests analytical and calculation skills. To support your preparation, we have compiled a set of Data Interpretation Questions for the IBPS RRB Exam with detailed solutions.
Data Interpretation Questions for IBPS RRB PO and Clerk 2025
Practicing these will help you enhance accuracy, improve speed, and build the confidence needed to excel in the exam. Below are some Data Interpretation (DI) questions that have appeared in the IBPS RRB Exam 2025.
Directions (1–5): The line graph given below shows total number five (A, B, C, D and E) different items sold by a shop. Read the data carefully and answer the following questions.
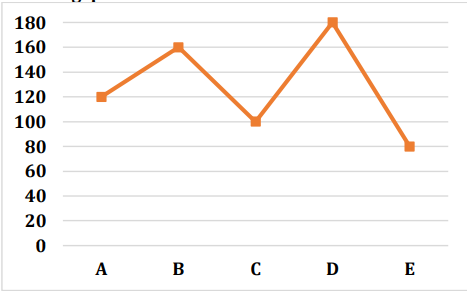
Q1. The ratio of items C and E sold by online to that of offline mode is 3 : 2 & 5 : 3 respectively. Find the difference between total item C and E sold by online mode.
(a) 6
(b) 10
(c) 8
(d) 12
(e) 5
Q2. Find the ratio of total number of item A to total number of item D sold by the shop.
(a) 3 : 5
(b) 2 : 5
(c) 1 : 3
(d) 1 : 2
(e) 2 : 3
Q3. If total item X sold by the shop is 50% more than total item B sold by the shop and total item X sold by online mode is 60% of total item X sold by the shop, then find total item X sold by offline mode.
(a) 96
(b) 72
(c) 76
(d) 106
(e) 90
Q4. Total number of item A and E sold by shop is what percent more than total number of items B sold by the shop.
(a) 20%
(b) 25%
(c) 24%
(d) 30%
(e) 40%
Q5. Find the difference between total item C & D sold by the shop and total item B & E sold by the shop.
(a) 40
(b) 50
(c) 30
(d) 20
(e) 10
Directions (6-10): Table given below shows total number of three different (Chocolate, Vanilla and Fruits) cakes sold by a bakery on three different days. Read the data carefully and answer the questions.
| Cakes | Sunday | Monday | Tuesday |
| Chocolate | 136 | 224 | 192 |
| Vanilla | 168 | 128 | 160 |
| Fruits | 144 | 176 | 236 |
Q6. Total number of chocolate cakes sold on Sunday and Tuesday together is what percentage more than total number of fruit cakes sold on Sunday and Monday together.
(a) 5/2%
(b) 2%
(c) 3/2%
(d) 7/2%
(e) 3%
Q7. Find the average number of all three types of cakes sold by shop on Tuesday.
(a) 188
(b) 198
(c) 192
(d) 186
(e) 196
Q8. Find the ratio of total number of fruit cakes sold on Sunday to total number of vanilla cakes sold on Sunday.
(a) 4 : 3
(b) 6 : 5
(c) 6 : 7
(d) 9 : 4
(e) 7 : 6
Q9. Total number of fruit cakes sold on Tuesday is how much more than total number chocolate cakes sold on Sunday.
(a) 90
(b) 80
(c) 100
(d)
(e) 60
Q10. Find the total number of chocolate cakes sold on all the given three days.
(a) 552
(b) 554
(c) 564
(d) 562
(e) 572

Directions (11-15): Table give below shows total number of books sold and unsold by three different shops. Read the data carefully and answer the questions.
| Shops | Number of books sold | Number of books unsold |
| A | 55 | 15 |
| B | 80 | 20 |
| C | 65 | 25 |
Q11. Find the difference between total books sold by C and total books unsold by A?
(a) 50
(b) 64
(c) 70
(d) 40
(e) 45
Q12. Find the ratio of total books in shop B to total books in shop C?
(a) 12 : 5
(b) 4 : 7
(c) 10 : 9
(d) 15 : 7
(e) 11 : 15
Q13. If number of books sold by shop D is 20 more than that by A and number of books unsold by shop D is 10 less than that by shop C, then find the total books in shop D?
(a) 70
(b) 97
(c) 82
(d) 90
(e) 92
Q14. Find the average of books unsold by all the shops?
(a) 20
(b) 26
(c) 25
(d) 30
(e) 15
Q15. Total books in shop A is what percent more/less than the shop B?
(a) 45%
(b) 70%
(c) 25%
(d) 60%
(e) 30%
Answers
S1. Ans.(b)
S2. Ans.(e)
S3. Ans.(a)
S4. Ans.(b)
S5. Ans.(a)
S6. Ans.(a)
S7. Ans.(e)
S8. Ans.(c)
S9. Ans.(c)
S10. Ans.(a)
S11. Ans.(a)
S12. Ans.(c)
S13. Ans.(d)
S14. Ans.(a)
S15. Ans.(e)
| Related Table | |
| IBPS RRB Clerk Cut Off | IBPS RRB PO Cut Off |
| IBPS RRB Clerk Salary | IBPS RRB PO Salary |
| IBPS RRB PO Syllabus | IBPS RRB Clerk Syllabus |
| IBPS RRB Previous Year Papers | |

 Data Interpretation Questions For Bank E...
 Data Interpretation Questions for SBI PO...
 Quantitative Aptitude Quiz For Bank Main...