

Direction (1-5) :- The line graph given below shows the production and consumption (in quintal) of Wheat in a 5 different years of a village. Study the graph carefully and answer the following questions.
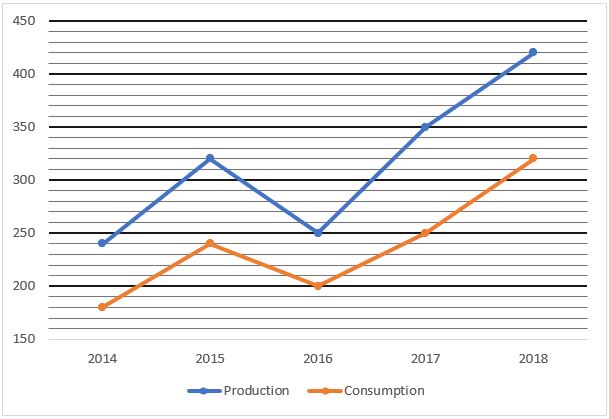
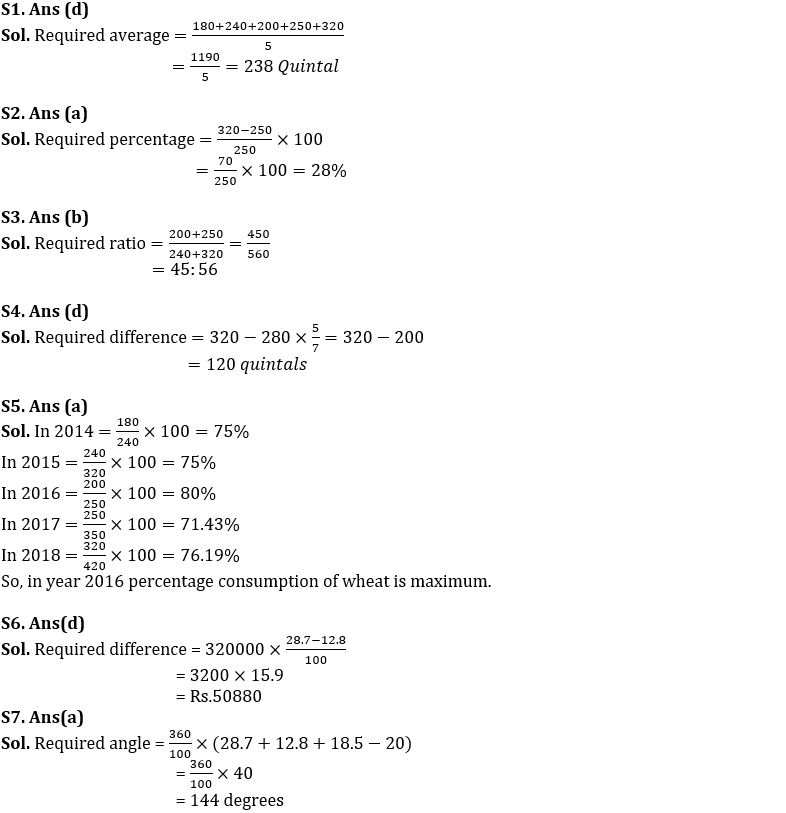
Q1. What is the average consumption of Wheat all over the years?
(a) 245 Quintals
(b) 254 Quintals
(c) 316 Quintals
(d) 238 Quintals
(e) 278 Quintals
Q2. Production of wheat in 2015 is what percentage more/less than that in 2016?
(a) 28%
(b) 33%
(c) 30%
(d) 25%
(e) 23%
Q3. What is the ratio between the consumption of wheat in 2016 and 2017 together to the production of wheat in 2014 and 2015 together?
(a) 45 : 53
(b) 45 : 56
(c) 12 : 17
(d) 15 : 17
(e) 30 : 53
Q4. If in 2019 the ratio between the production and consumption of wheat is 7 : 5 and total production of wheat is 280 Quintal, then consumption of wheat in 2019 is how much more/less than previous year?
(a) 150 quintals
(b) 180 quintals
(c) 140 quintals
(d) 120 quintals
(e) 220 quintals
Q5. In which year percentage of consumption of wheat is maximum with respect to production?
(a) 2016
(b) 2018
(c) 2015
(d) 2017
(e) 2014
Directions (6-10): – Pie chart given below shows percentage break up of revenue generated by six different items (LED, refrigerator, cable, laptops, mobile and calculator) of a shop in a month? (assume shop sell only these six items)
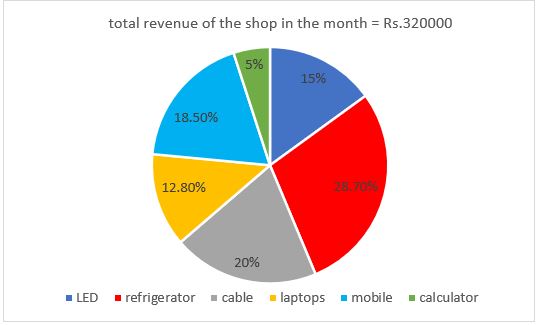
Q6. Revenue from refrigerator is how much more than revenue from laptops?
(a) Rs.40960
(b) Rs.64000
(c) Rs.59200
(d) Rs.50880
(e) Rs.48000
Q7. What is the difference between central angle (in degree) formed by revenue from refrigerator, laptops and mobile together and revenue from cable?
(a) 144
(b) 108
(c) 72
(d) 180
(e) 240
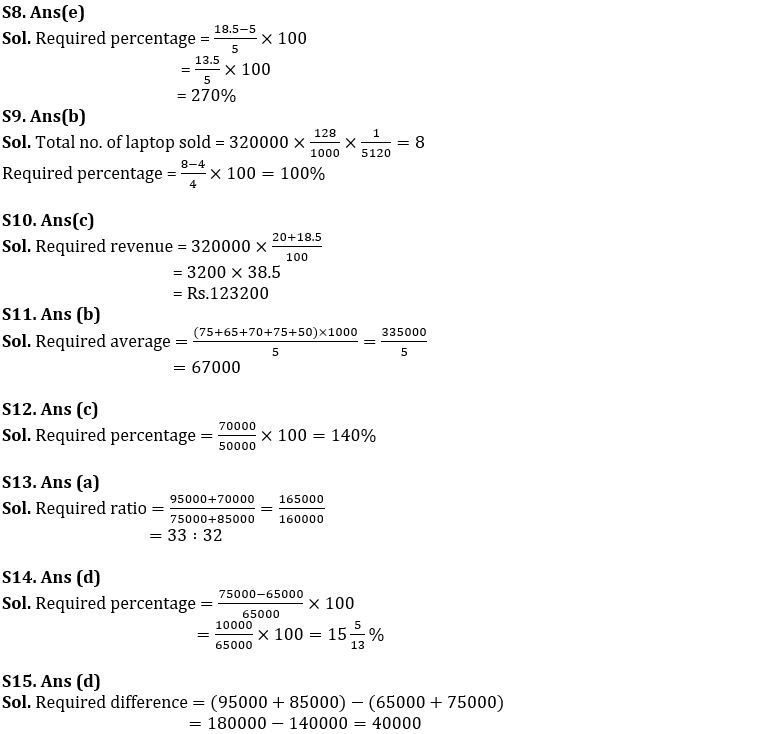
Q8. Revenue from mobile is how much percent more than revenue from calculator?
(a) 370%
(b) 225%
(c) 250%
(d) 275%
(e) 270%
Q9. If total 4 LED were sold in that month and selling price of each laptop in that month is Rs.5120, find no. of laptop sold is how much percent more than no. of LED sold in that month?
(a) 50%
(b) 100%
(c) 25%
(d) 75%
(e) 200%
Q10. What is the total revenue (in Rs.) from cable and mobile together?
(a) 223100
(b) 123000
(c) 123200
(d) 148200
(e) None of these.
Directions (11-15) :- The line graph shows the no. of passengers who travels from Metro in 7 days of a given week. Study the graph carefully and answer the following question.
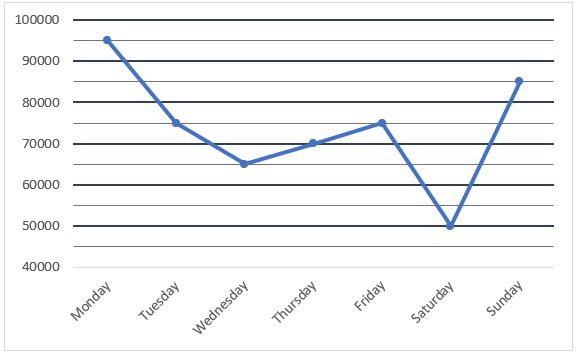
Q11. What is the average no. of passenger travels from Tuesday to Saturday?
(a) 64000
(b) 67000
(c) 72000
(d) 70000
(e) 75000
Q12. Passenger who travel on Thursday are what percentage of passengers who travels on Saturday?
(a) 120%
(b) 71.4%
(c) 140%
(d) 87.5%
(e) 175%
Q13. Find the ratio of no. of passenger travels on Monday and Thursday together to Tuesday and Sunday together.
(a) 33 : 32
(b) 33 : 34
(c) 17 : 16
(d) 1 : 1
(e) 3 : 2
Q15. Passenger travels on Wednesday and Friday together are how much more or less than that on Sunday and Monday together?
(a) 30000
(b) 50000
(c) 35000
(d) 40000
(e) 45000
Solutions


 FCI Assistant Grade 3 Previous Year Ques...
 Data Interpretation Questions for IBPS R...
 Data Interpretation Questions For Bank E...


