

Directions (1-5):- The given pie chart shows percentage distribution of various expense of a family in a given month.
Study the graph carefully and answer the following questions.
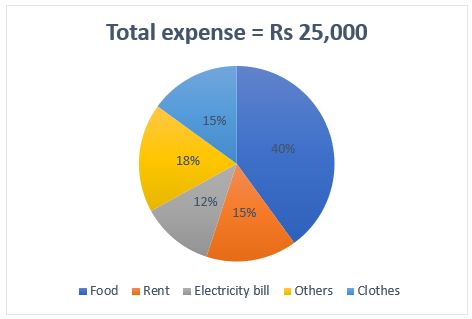
Note:- Monthly Income =Expense+Savings
Q1. What is the average expense on Rent, Electricity bill and Others?
(a) Rs 5000
(b) Rs 3000
(c) Rs 3750
(d) Rs 2750
(e) Rs 3250
Q2. If expense on Food is 125/4% of monthly family income, then find the total monthly income of family.
(a) Rs 28000
(b) Rs 42000
(c) Rs 35000
(d) Rs 38000
(e) Rs 32000
Q3. If expense on Others consist of Telephone bill, expense on Entertainment and expense on commuting in the ratio 4∶6∶5, then monthly expense on Electricity bill is what percent more or less than that on Telephone bill?
(a) 100%
(b) 150%
(c) 200/3%
(d) 125%
(e) 75%
Q4. If monthly saving of the family is 30% of the monthly income, then find the ratio of the expense on the Clothes to Savings of the family.
(a) 3/20
(b) 7/20
(c) 11/20
(d) 9/20
(e) 1/4
Q5. Find central angle (in degrees) of monthly expense of family on electricity bill.
(a) 76.4
(b) 68.6
(c) 32.8
(d) 54.6
(e) 43.2
Directions (6-10) :- Study the given bar graph carefully and answer the following questions.
The bar graph given below shows the produced and sold units of mobiles by 5 different companies in a month.
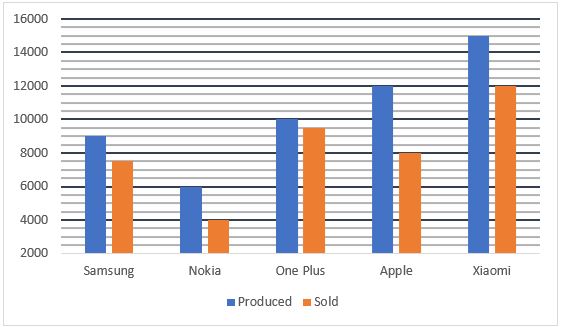
Note – Total produced mobiles in a month of each company = Total (sold + unsold) mobiles of that company in that month.
Q6. Sold units of Xiaomi mobile is how much more/less than sold units of Samsung?
(a) 2500
(b) 3500
(c) 3000
(d) 4500
(e) 1500
Q7. Mobiles produced by Samsung and Nokia together are what percent more than mobiles produced by Apple?
(a) 80%
(b) 75%
(c) 60%
(d) 40%
(e) 25%
Q8. What is average no. of unsold units of Samsung, Nokia and Apple?
(a) 2666
(b) 3500
(c) 2500
(d) 1500
(e) 1750
Q9. Sold units of Samsung is what percentage of unsold units of Nokia and Apple together?
(a) 125%
(b) 80%
(c) 150%
(d) 75%
(e) 100%
Q10. If market price of each sold mobile of One plus and Apple are in the ratio of 4 : 5 respectively, then find the ratio between revenue of One plus to Apple.
(a) 19 : 25
(b) 19∶20
(c) 20 : 17
(d) 20∶19
(e) 17∶19
Directions (11-15) :- Study the line graph carefully and answer the following questions.
The line graph shows the runs scored by two different teams in a series of 5 cricket matches.
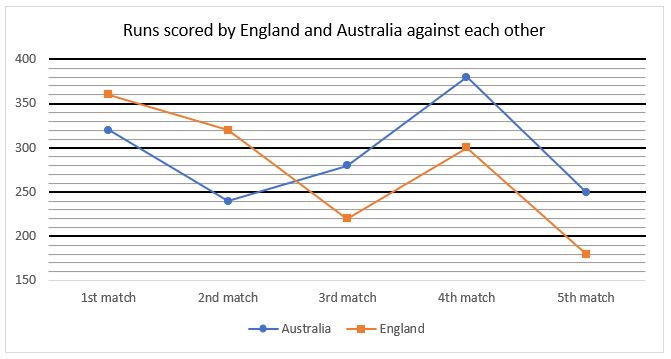
Q11. Runs scored by Australia in first and third match together is what percent of runs scored by England in second and fifth match together?
(a) 100%
(b) 125%
(c) 83⅓%
(d) 120%
(e) 75%
Q12. Find the difference between maximum runs scored by England and minimum runs scored by Australia.
(a) 120 runs
(b) 80 runs
(c) 150 runs
(d) 200 runs
(e) 180 runs
Q13. What is the ratio between total runs scored by Australia to that of England in all matches?
(a) 25∶23
(b) 46∶47
(c) 43∶46
(d) 49∶46
(e) 23∶43
Q14. Runs scored by Australia in second match is what percent more or less than runs scored by England in fourth match?
(a) 25%
(b) 20%
(c) 35%
(d) 10%
(e) 50%
Q15. Australia won how many matches out of all the five matches?
(a) 1
(b) 4
(c) 3
(d) 5
(e) 2
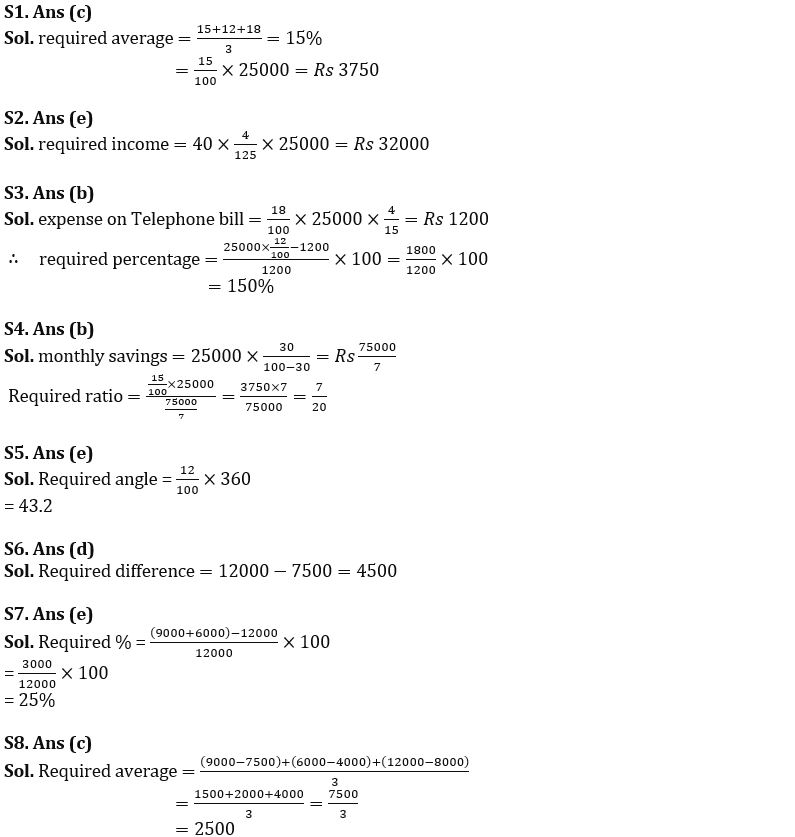
Solutions


 Data Interpretation Questions for IBPS R...
 Data Interpretation Questions For Bank E...
 Data Interpretation Questions for SBI PO...


