

.
Quantitative Quiz For IDBI AM/Executive 2022 17th June CHECK IN HINDI
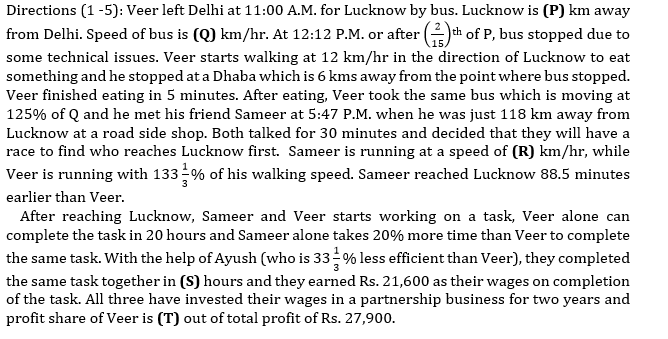
Q1. What is the ratio of value of Q to that of the value of P?
(a) 1:8
(b) 1:9
(c) 2:15
(d) 2:21
(e) 3: 25
Q2. Value of Q is what times of value of R?
(a) 3 times
(b) 2 times
(c) 8 times
(d) 4 times
(e) 6 times
Q3. What is the value of S?
(a) 5 hours
(b) 10 hours
(c) 9 hours
(d) 6 hours
(e) 8 hours
Q4. What is the value of T?
(a) Rs 11750
(b) Rs 12250
(c) Rs 11160
(d) Rs 13750
(e) Rs 12950
Q5. Veer invested his profit share in a scheme for two years which offers CI at 20% per annum. Find the compound interest received in 2nd year?
(a) Rs 8490
(b) Rs 8370
(c) Rs 8600
(d) Rs 8210
(e) Rs 8420
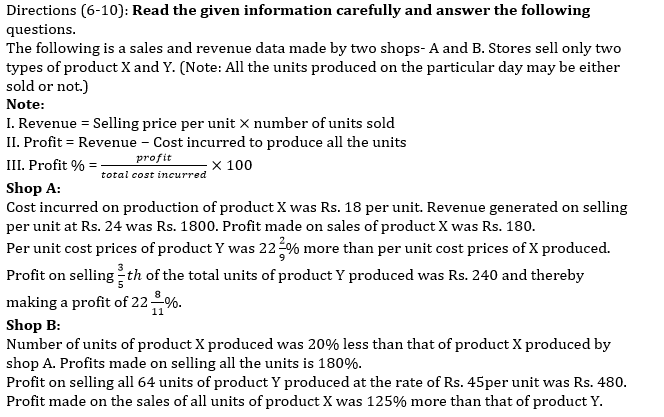
Q6. Number of units of product X that remains unsold in shop A is what percent of number of units sold of product Y by the same shop?
(a) 30%
(b) 35%
(c) 31 ¼ %
(d) 27 ½ %
(e) 32 ½ %
Q7. Revenue generated by shop A on selling all the units of product Y produced is what percent more or less than total cost incurred in producing all the units of product X by shop B ?
(a) 300%
(b) 280%
(c) 220%
(d) 240%
(e) 260%
Q8. Find the ratio of per unit selling price of product X for shop B to the per unit cost price of product Y for the same shop?
(a) 28:45
(b) 24:37
(c) 35:53
(d) 14:15
(e) 40:53
Q9. Find the difference between total cost incurred by shop A in producing all the units of both the items and the total cost incurred by shop B in producing all the units of both the items?
(a) Rs 320
(b) Rs 340
(c) Rs 360
(d) Rs 380
(e) Rs 400
Q10. Had the cost incurred on per unit of product X produced by shop A been 25% less than the original and had it been able to sell 60 units each of products Y and X produced that day, then what would have been the total profit made by shop A on selling both the products?
(a) Rs 65
(b) Rs 85
(c) Rs 90
(d) Rs 80
(e) Rs 45
Directions (11-15): Given below is the pie-chart which shows the percentage distribution of total population of six villages in year 2016 and line graph shows the percentage of males out of total population in each village.
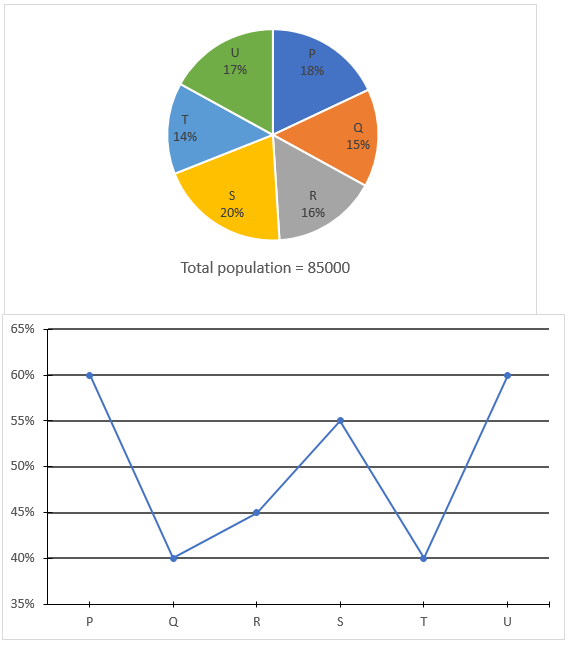
Q11. What is the ratio of total female from village P and Q together to the total males from village S and U together?
(a) 81 : 106
(b) 82 : 107
(c) 106 : 81
(d) 112 : 143
(e) None of these
Q12. If 20% females in village R and 33 ⅓% of males in village P are ill due to disease then females who are not ill from village R is what approximate percent of males who are not ill from village P.(approximately)
(a) 100%
(b) 105%
(c) 80%
(d) 88%
(e) 98%
Q13. What is the ratio of sum of females from village Q and T together to the total population of Q.
(a) 146 : 111
(b) 111: 146
(c) 25 : 93
(d) 497 : 500
(e) 29 : 25
Q14. Total female from village S and T together are what percent of total population from village R and T together
(a) 50%
(b) 54%
(c) 47%
(d) 58%
(e) 62%
Q15. If in year 2017 total population of village P increases by 25% whereas females population increases by 30% then by what percent male population of village P increases or decreases in 2017 over year 2016. (approximately)
(a) 16%
(b) 37%
(c) 28%
(d) 12%
(e) 22%
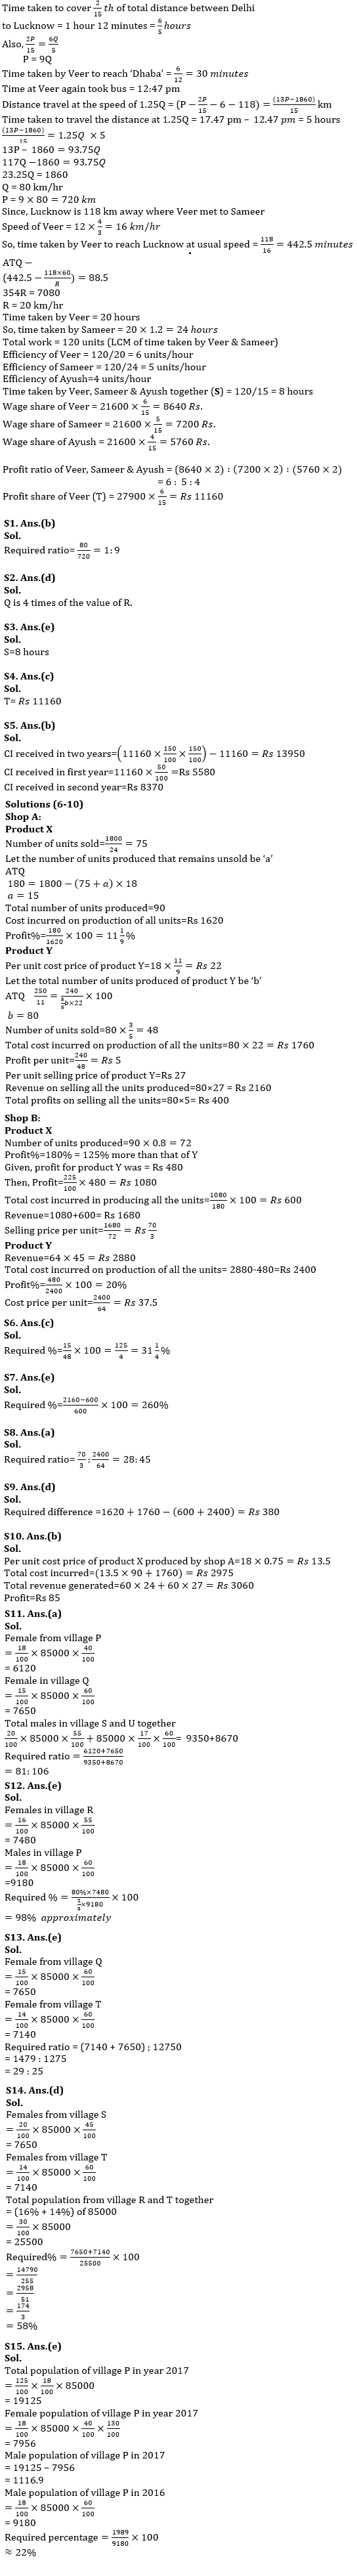
Solutions
Solutions(1-5)


 80 Most Important General Awareness Ques...
 Daily Current Affairs and GK Updates (3r...
 IB ACIO Cut Off 2026, Check Previous Yea...


