

Directions (1-5): Please understand the data carefully and answer the following questions.
The pie chart shows distribution of number of students who applied for six different courses, B.Sc, M.Sc, MCA, B.Tech, BCA and BA.
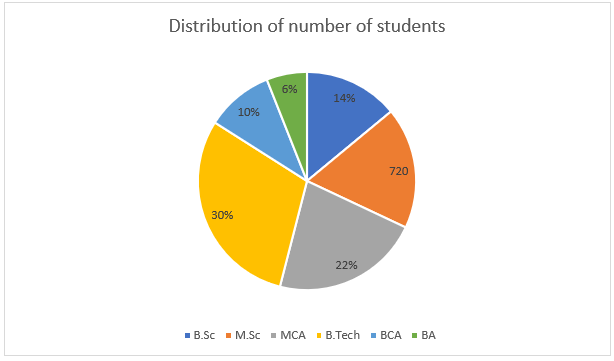
Q1. If the ratio of girls to boys who applied for B.Tech course is 2:3, then find the number of boys who applied for B.Tech course?
(a)680
(b)720
(c)640
(d)760
(e)600
Q2. If 25% of the students who applied for MCA did not qualified, then find the number of students who qualified for the MCA course?
(a)720
(b)640
(c)700
(d)680
(e)660
Q3. Find the respective ratio of average number of students who applied for BA & B.Sc to the number of students who applied for M.Sc?
(a)8:5
(b)8:7
(c)5:9
(d)7:8
(e)9:5
Q4. Find the number of students who applied for MCA course is what percent more/less than the number of students who applied for BCA?
(a)130%
(b)115%
(c)125%
(d)120%
(e)110%
Q5. If only 75% of the total students who applied for the different courses are qualified, then find the ratio of number of students who qualified to the number of students who applied for B.Tech & M.Sc together.
(a)25:16
(b)7:9
(c)9:7
(d)16:27
(e)16:9
Direction (6-10): Please understand the data carefully and answer the following questions.
The following line chart shows the distribution of number of students of five different classes, 6, 7, 8, 9 & 10, in three different sections, A, B & C.
Note: Total students in any class = Sum of students in all three sections together.
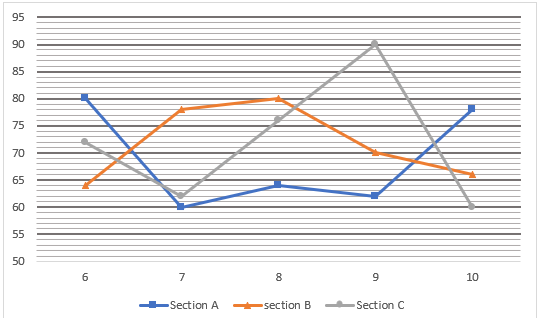
Q6. Find the number of students in class 6 & 7 together are approximately what percent more/ less than the number of students in class 8 & 9 together.
(a)8%
(b)7%
(c)4%
(d)5%
(e)6%
Q7. If the respective ratio of boys to girls in section A of class 7 is 2:3, then find the respective ratio of boys in section A of class 7 to the number of students in section B of class 8?
(a)5:3
(b)8:5
(c)3:10
(d)5:8
(e)10:3
Q8. If ‘s’ be the square root of the difference between the total number of students in section A of all five classes and section C of all five classes together, then find the value of 7.5s-10? ?
(a)20
(b)30
(c)10
(d)40
(e)50
Q9. If ‘n’ be the number of students in section C of class 11 and the respective ratio of students in section A, B and C of class 11 is 5:2:4, then find the value of 5n-80, given that total number of students in class 11 is 50% more than the number of students in class 8?
(a)360
(b)420
(c)600
(d)520
(e)560
Q10. Find the respective ratio of total number of students in section B of class 8 & 9 together to the total number of students in class 10?
(a)24:37
(b)25:34
(c)37:24
(d)34:25
(e)24:31
Directions (11-15): Please understand the data carefully and answer the following questions.
The given Pie chart shows the percentage of students who opted five different courses during their summer break from school.
Note: One student opted for only one course.
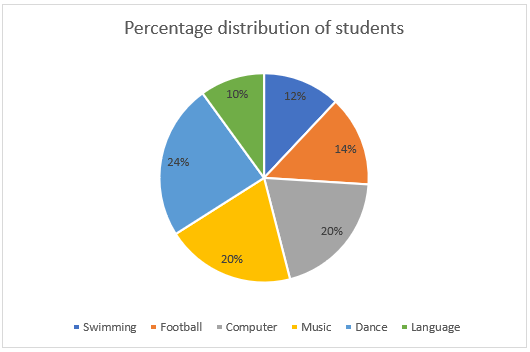
Q11. Find the number of students who opted for Swimming course, if the number of students who opted for Dance course are 40% of 640?
(a)128
(b)140
(c)112
(d)136
(e)104
Q12. Find the sum of number of students who opted for Football & Language course, if the average number of students who opted for Computer, Music and Dance are 160?
(a)108
(b)180
(c)96
(d)132
(e)144
Q13. Find the central angle made by Swimming & Computer course together is how much more/less degrees than the central angle made by Dance & Football course together?
(a)18.4°
(b)19.1°
(c)24.2°
(d)21.6°
(e)17.8°
Q14. If number of girls who opted Dance course are 62.5% more than that of boys and the difference between the students who opted Music course and that opted Football course is 42, then find the number of girls who opted Dance course?
(a)84
(b)88
(c)104
(d)96
(e)112
Q15. Find the average number of students who opted Football & Music courses are what percent more/less than the number of students who opted Swimming course?
(a)37.5%
(b)25%
(c)12.50%
(d)Data not sufficient
(e)41.67%
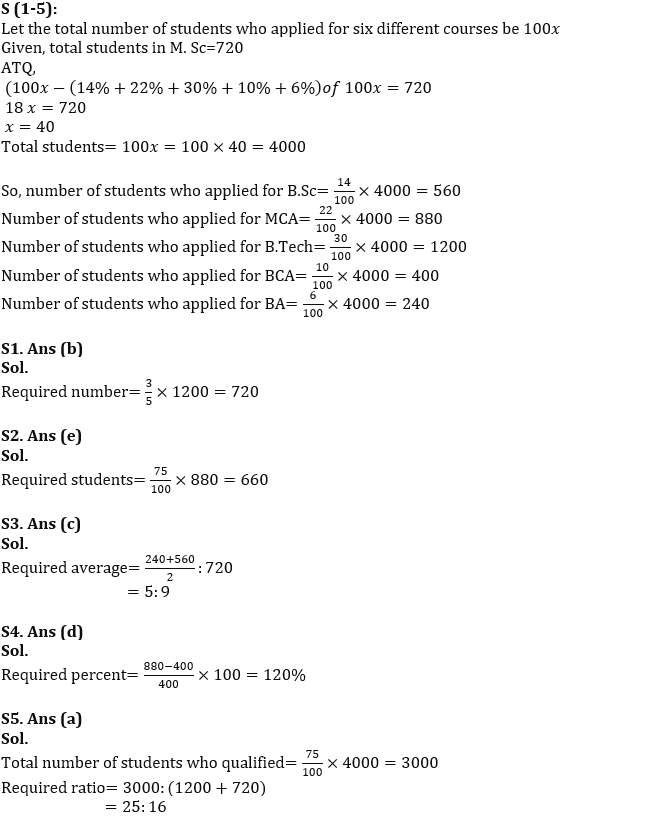
Solutions


 JAIIB RBWM Exam Analysis 2026, 17 May Al...
 JAIIB RBWM Memory Based Questions, Downl...
 How Toppers Start Preparing for IBPS SO?


