

In the evolving pattern of Banking Exams 2026, Data Interpretation (DI) has become a game-changing section that can significantly impact a candidate’s overall score in prelims as well as mains examinations. Modern DI sets are no longer limited to basic calculations; they now focus on analytical thinking, speed, accuracy, and smart data handling under pressure.
Data Interpretation For Bank Exams
In Banking Exams 2026, Data Interpretation questions are asked through formats like tables, pie charts, bar graphs, line graphs, and caselets to test candidates’ calculation speed, accuracy, and analytical skills. With DI becoming more calculation-intensive in recent exams, aspirants must focus on quick calculations, smart question selection, and regular practice of different DI sets.
From caselet DI to arithmetic-based charts and mixed data sets, candidates are expected to solve complex questions quickly while maintaining precision. In this article, we will discuss effective preparation strategies, shortcut techniques, and practice methods to improve accuracy and score in the DI section.
Types of Data Interpretation Questions
Data Interpretation questions in bank exams appear in various formats, each requiring a distinct approach and skill. Understanding the different types of DI questions is essential for preparation.
- Bar Graph- Candidates are required to interpret the information presented in the bar graph and answer questions based on the data provided.
- Line Graph- Candidates must analyse the trends depicted in the line graph and answer questions related to the trends, differences or comparisons.
- Pie Chart- Candidates need to interpret the proportions or angles presented by each sector and answer questions related to percentages, fractions or comparisons
- Tables- Candidates are required to analyze the data presented in the table and answer questions involving calculations, comparisons, or inferences.
- Caselets- Candidates must read the caselet carefully, interpret the accompanying data, and answer questions based on the information provided in the caselet.
- Data Sufficiency- Candidates must evaluate each statement independently and determine whether the information provided is adequate to solve the problem.
Importance of Data Interpretation
Data Interpretation assesses your ability to analyze complex numerical data, extract key information, and make informed decisions. It is crucial not only for clearing bank exams but also for handling real-world banking tasks like analyzing financial statements, tracking market trends, and assessing risk.
Key Highlights & Exam Weightage
- High Importance: DI carries substantial weightage across all major bank exams, including SBI, IBPS, RBI, and NABARD.
- Preliminary Level: Typically accounts for 10 to 15 marks of the quantitative aptitude section.
- Mains Level: Its importance increases significantly, often featuring as a dedicated, separate section.
- Career Readiness: Mastery of DI directly prepares you for daily banking operations that rely heavily on data-driven decisions.
Tips to Solve Data Interpretation
Solving DI is that hard or time-consuming, candidates need the right approach to solve them. Here are some effective tips to solve Data Interpretation questions and excel in bank exams.
- Understand the question:
- Read the question carefully and understand the data of the problem
- Identify the type of DI i.e. bar graph, pie chart, table, etc.) and understand the information required to answer the questions.
- Focus on Key Information
- Identify the key data provided, such as numerical values, labels, percentages, ratios, units, etc.
- Remember or take note of important data that is essential for solving the question
- Simplify Complex Data
- Break down complex data into smaller or simpler one
- Look for trends, patterns, comparisons, relationships, etc. that can help calculations.
- Approximate & Estimates
- Use estimation and approximation, when solving large numbers or complex calculations, to reach quicker solutions
- Round off to simplify calculations
- Use Tricks and Shortcuts
- While practising use shortcuts or tricks, for quick calculations such as percentage shortcuts, approximation methods, mental maths, etc.
- Verify Data Accuracy
- Double-check the numerical values, and interpretations to maintain accuracy.
- If Time permits, recheck the solution
DI Preparation For Bank Exams: Strategies
- Understand the Exam Pattern:
- Familiarize yourself with the DI section’s format, including the types of questions asked, such as bar graphs, pie charts, line graphs, tables, and caselets.
- Analyze previous years’ question papers to identify recurring patterns and the level of difficulty.
- Strengthen Fundamentals:
- Build a strong foundation in basic mathematical concepts such as percentages, ratios, averages, and proportions, as these form the basis of DI questions.
- Practice arithmetic calculations to improve speed and accuracy, as DI questions often involve numerical calculations.
- Develop Visualization Skills:
- Train yourself to visualize and interpret graphical representations of data quickly and accurately.
- Practice interpreting various types of charts and graphs to extract key insights and trends.
- Practice Regularly:
- Dedicate regular study sessions specifically for DI practice, focusing on solving a variety of DI questions from different sources.
- Set aside time for daily or weekly mock tests to simulate exam conditions and improve time management skills.
- Learn Shortcut Techniques:
- Familiarize yourself with shortcut techniques for solving DI questions efficiently, such as approximation, ratio analysis, and percentage calculations.
- Mastering shortcut techniques can significantly reduce the time required to solve complex DI problems during the exam.
- Focus on Accuracy and Speed:
- Strive for a balance between accuracy and speed while solving DI questions. Practice solving questions accurately within a stipulated time frame.
- Avoid spending too much time on individual questions. If a question seems too time-consuming, consider skipping it and returning to it later if time permits.
- Review and Analyze Mistakes
- Analyze your performance in practice tests and identify areas of weakness or recurring mistakes.
- Focus on improving your understanding of concepts and addressing common errors through targeted practice and revision.
Common Mistakes to Avoid in Data Interpretation
Data Interpretation (DI) is a critical component of bank exams, and avoiding common mistakes can significantly impact your performance. Here are some prevalent mistakes to avoid while tackling DI questions
- Misreading Data: Misinterpreting or misreading the data presented in graphs, tables, or charts can lead to inaccurate conclusions. Always double-check the data and ensure you understand the information presented before attempting to answer questions.
- Ignoring Units: Neglecting to pay attention to the units of measurement provided in the data can result in incorrect calculations and answers. Verify the units associated with numerical values and ensure consistency in your calculations.
- Rushing Through Questions: Attempting to solve DI questions hastily without understanding the data or the question requirements can lead to errors. Take your time to carefully analyze the information presented and formulate a systematic approach to solving each question.
- Overlooking Data Trends: Failing to identify and analyze trends or patterns depicted in graphs or charts can result in missed opportunities to derive insights from the data. Pay close attention to trends, fluctuations, and relationships between variables to answer questions accurately.
- Skipping Caselets: Caselet-based DI questions often involve reading a passage or scenario followed by related data. Skipping the caselet or not understanding the context can lead to incorrect answers. Read the caselet carefully, extract relevant information, and use it to answer the accompanying questions.
- Inadequate Practice: Insufficient practice with DI questions can hinder your ability to interpret data accurately and efficiently during the exam. Practice regularly with a variety of DI questions from previous years’ papers and mock tests to build confidence and improve your problem-solving skills.
- Relying Solely on Memory: Attempting to solve DI questions purely from memory without referring back to the data provided can result in errors. Always refer back to the data presented in graphs, tables, or charts to verify your calculations and ensure accuracy.
- Not Using Shortcut Techniques: Failing to leverage shortcut techniques and strategies for solving DI questions can lead to time wastage during the exam. Familiarize yourself with shortcut methods for calculations, percentage conversions, and ratio analysis to solve questions more efficiently.
- Inaccurate Approximations: Incorrectly approximating numerical values or rounding off numbers can lead to inaccurate calculations and answers. Practice accurate approximations and rounding-off techniques to ensure precise calculations while saving time.
- Neglecting Data Sufficiency: Disregarding the importance of evaluating data sufficiency in DI questions can result in choosing the wrong answer option. Analyze each statement carefully in data sufficiency questions to determine whether the provided data is adequate to answer the question.
Data Interpretation Questions For Practice
Questions are invaluable resources for preparing for the Data Interpretation section of Bank Exams. Here are a few Data Interpretation Questions for Practice.
Directions (1 – 5): Study the following questions and choose the correct answer.
State-wise production of different crops for the year 1993-94 (in million tonnes)
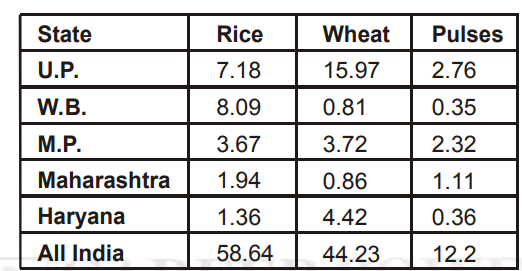
1. W.B. produces approximately what percent of the total rice produced in India?
- 12.2%
- 13.5%
- 18%
- 15%
- None of these
2. The amount of wheat produced by U.P. is more than the amount of wheat produced by the other four states listed in the table, by
- 6.97 m tonnes
- 6.16 m tonnes
- 5.52 m tonnes
- 5.89 m tonnes
- None of these
3. What percentage of the total wheat production was produced by states other than those who are not given in the table?
- 38%
- 42%
- 48%
- 58%
- None of these
4. U.P. produced approximately what percent of the all India production of all the three crops taken together?
- 27.75%
- 26.2%
- 24.18%
- 22.52%
- None of these
5. Which of the following statements is true?
- U.P. was the top producer of all three crops.
- M.P. ranked third in the production of all three crops.
- Maharashtra was the lowest producer of rice.
- Haryana was the lowest producer of wheat.
- None of these
Directions (06 – 10): These questions are based on the following pie graph.
Spending Pattern of an Average Worker
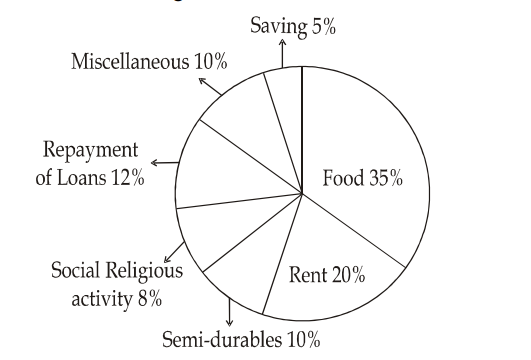
Spending patterns of hard workers 100% = Rs. 3500
Spending Pattern of Mr. Hardworker
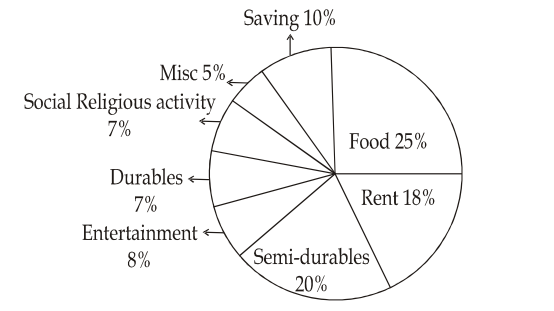
06. For the categories that are common for both, for which category does Mr. Hard Worker spend more than the average worker?
- Rent
- Durables
- Semi-durables
- Entertainment
- None of these
07. How much does Mr Hard Worker spend on categories that are not included in the spending pattern of an average worker?
- Rs. 100
- Rs. 225
- Rs. 525
- Rs. 450
- None of these
08. The additional saving of 5% of Mr Hard Worker comes from his savings under?
- Food
- Repayment of loans
- Misc.
- Data inadequate
- None of these
09. If the salary of Mr Hard Worker is increased by 20% and his expenses under all the heads remain the same, what will be his percentage savings?
- 10%
- 15%
- 20%
- 25%
- None of these
10. Which of the following is definitely true?
I. Mr. Hard worker has a smaller family than the average worker.
II. Mr. Hard worker has not borrowed any money.
III. Mr. Hard worker spends less on necessities and more on comforts
- I only
- II only
- I, II and III only
- Data inadequate
- None of these
Directions (11 – 15): Study the following table and answer the following questions:
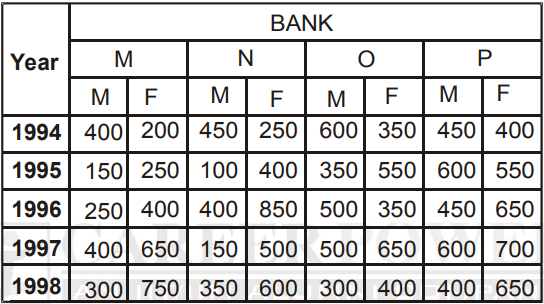
11. What was the ratio of the number of females, in Bank P in the year 1995, the number of males in bank M is the year 1996 and the number of females in Bank N in the year 1995?
- 11 : 5 : 9
- 12 : 5 : 7
- 11 : 6 : 8
- 12 : 5 : 9
- 11 : 5 : 8
12. What was the average number of male employees working in all the Banks together in 1994?
- 450
- 475
- 385
- 300
- None of these
13. If 20 percent of female and 30 percent of male employees in Bank N in the year 1994 were handicapped, then what was the total number of handicapped candidates in the Bank in that year?
- 185
- 170
- 190
- 195
- None of these
14. What was the total number of females working in Bank M in the year 1997, females working in Bank N in the year 1995 and males working in Bank P in the year 1996 together?
- 1500
- 1550
- 1450
- 1400
- None of these
15. Total number of female employees working in Bank O over the year together was approximately what percentage of the total number of employees working in the year 1997 in all the Banks?
- 45
- 50
- 55
- Cannot be determined
- None of these
Directions (16 – 20): Study the following graph carefully to answer the questions:
Quantity of Onion (in hundred tonnes) Purchased by three Dealers over the years
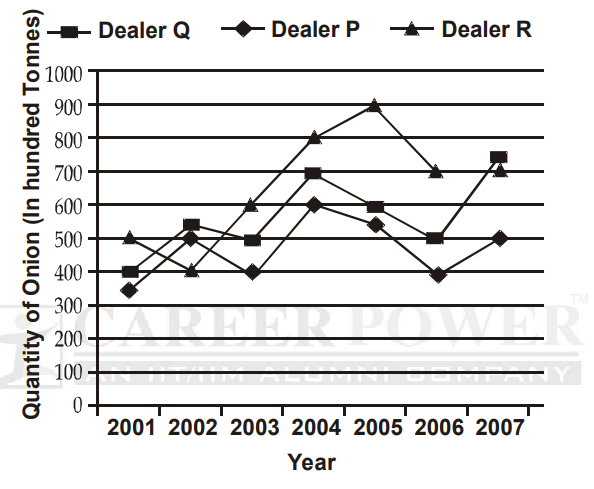
16. The percentage rise in the purchase of onions from the previous year was the maximum during which year for dealer Q?
- 2003
- 2004
- 2005
- 2007
- None of these
17. What is the average purchase of Onions by dealer Q for all the years? (in hundred tones rounded off to two digits after decimal)
- 571.42
- 667.14
- 766.67
- 756.57
- None of these
18. Total Onions purchased by dealer P for all the years is approximately what percent of the total onions purchased by dealer Q for all the years?
- 128
- 139
- 68
- 82.5
- 72
19. What is the percent increase in the purchase of onions from dealer R from 2003 to 2007?
- 150
- 133.33
- 33.33
- 50
- None of these
20. What is the ratio of the total quantity of onions purchased by all three dealers in 2002 to that in 2004?
- 51 : 29
- 9 : 40
- 29 : 51
- 29 : 42
- None of these
| Solutions | |||||||||
| 01. | b | 02. | b | 03. | b | 04. | d | 05. | a |
| 06. | c | 07. | c | 08. | d | 09. | d | 10. | b |
| 11. | e | 12. | b | 13. | e | 14. | a | 15. | c |
| 16. | d | 17. | a | 18. | d | 19. | e | 20. | d |


 RBI Grade B Score Card 2026 Out, Downloa...
 RBI Assistant Score Card 2026, Download ...
 Do's and Dont's For LIC HFL Junior Assis...

