

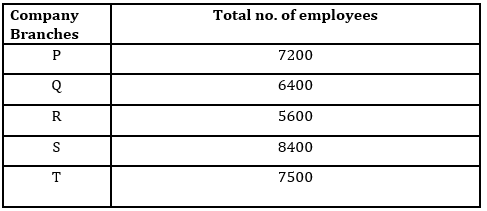
Directions (1-5): A company have five branch office (P, Q, R, S & T) and each office have six different departments (A, B, C, D, E & F). Table shows total employees in each five branch and pie chart shows distribution of employees in each department.
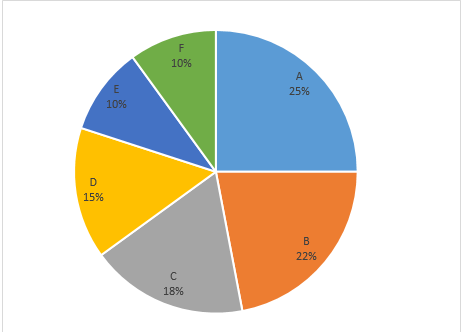
(Note: company has decided to keep same % of employees in each six department in each five branches)
Q1. What is ratio between total employees in A and D department from branch P to total employees in B & C department from branch S ?
(a) 7 : 6
(b) 6 : 5
(c) 6 : 11
(d) 6 : 7
(e) None of these
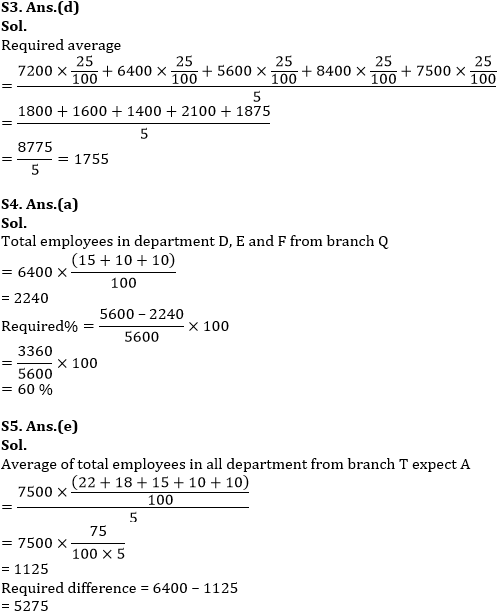
Q3. Find the average of total employees in department A from the all five branches of the company?
(a) 1725
(b) 1735
(c) 1745
(d) 1755
(e) 1765
Q4. Employees in department D, E and F from branch Q together are what percent less than total employees from branch R ?
(a) 60%
(b) 55%
(c) 65%
(d) 58%
(e) 50%
Q5. What is difference between average of employees in all departments except A from branch T and total employees in branch Q ?
(a) 5435
(b) 5245
(c) 5265
(d) 5215
(e) 5275
Directions (6-10): Study the given passage carefully and answer the questions.
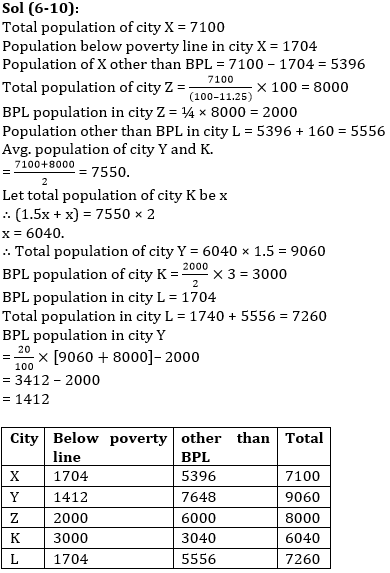
The total population of city X is 7100 out of which 24% population are below poverty line. And total population of city X is 11¼ % less than total population of city Z and 25% of population in city Z is below poverty line. Population other than below poverty line in city L is 160 more than population of city X which are not below poverty line.
Average population of Y and K is equal to average population of city X and Z & population of Y is 150% of population of K. Ratio of BPL in city Z to city K is 2 : 3. 20% of total population are BPL in city Y and Z. BPL in city L is equal to BPL in city X.
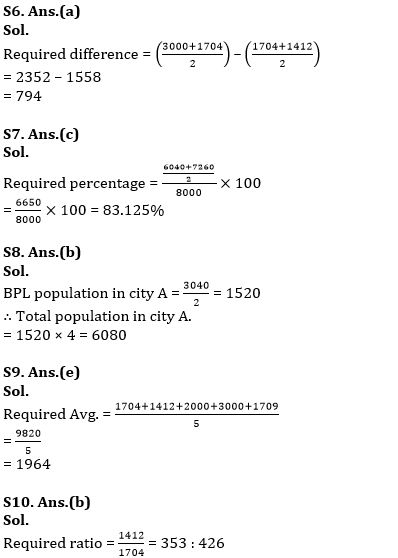
Q6. Average BPL population in city X and Y is how much more/less than average BPL population in city K and L ?
(a) 794
(b) 824
(c) 848
(d) 764
(e) None of these
Q7. Average population in city K and L is what percent of total population in city Z ?
(a) 93%
(b) 73%
(c) 83.125%
(d) 87.50%
(e) 78.625%
Q8. In another city ‘A’, BPL population is half of the population other than BPL in city K which is 25% of total population. Then find total population in city A ?
(a) 6820
(b) 6080
(c) 6240
(d) None of these
(e) 6040
Q9. What is the average BPL population in all the cities ?
(a) 1924
(b) None of these
(c) 1884
(d) 1724
(e) 1964
Q10. What is the ratio of BPL population in city Y to city L ?
(a) 426 : 353
(b) 353 : 426
(c) 351 : 425
(d) None of these
(e) 353 : 428
Solutions


 Puzzle Questions for SBI PO Exam
 LIC HFL Admit Card 2026 Out, Steps to Do...
 Daily Current Affairs and GK Updates (5t...


