Directions (1-5): Pie chart given below shows percentage distribution of male population of five villages. Study the pie chart carefully and answer the following questions.
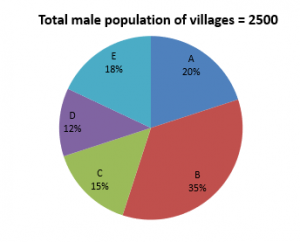
Note: Ratio between the total male population to total female population of the given villages is 10 : 7.
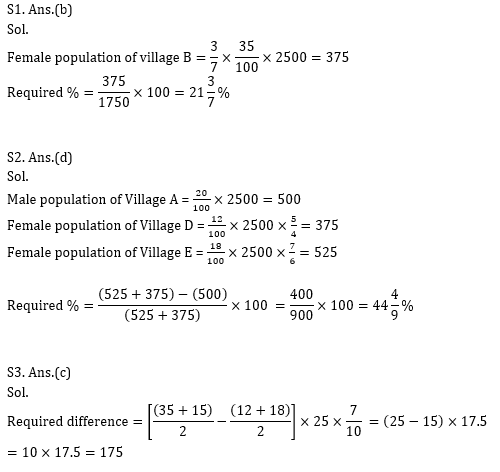
Q3. Find the difference between the average female population of village B and C together and the average female population of D and E together if percentage distribution of male and female in each village is same?
(a) 150
(b) 200
(c) 175
(d) 300
(e) 250
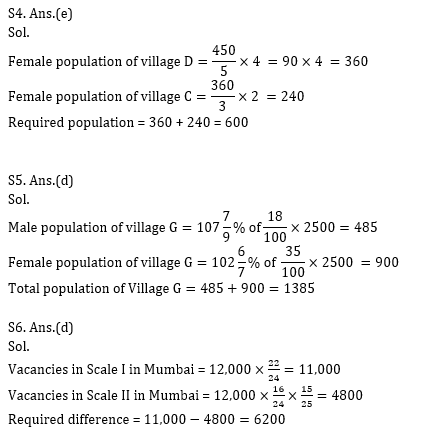
Q4. Ratio of female population of village C to that of village D is 2 : 3 and the ratio of female population of village D to male population of village E is 4 : 5 then find the total female population of village D and C together ?
(a) 300
(b) 750
(c) 120
(d) 450
(e) 600
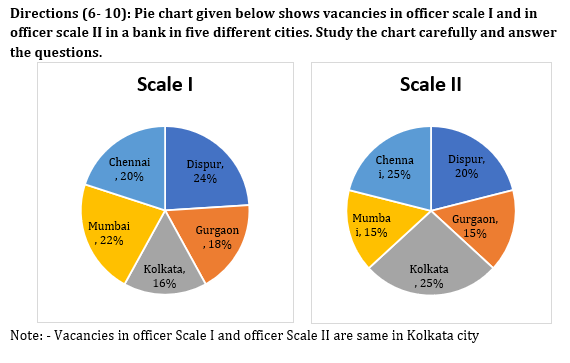
Q6. Vacancies in Scale I in Dispur is 12,000 then find the difference between vacancies in Scale I and Scale II in Mumbai?
(a) 4,800
(b) 5,400
(c) 5,800
(d) 6,200
(e) 6,600
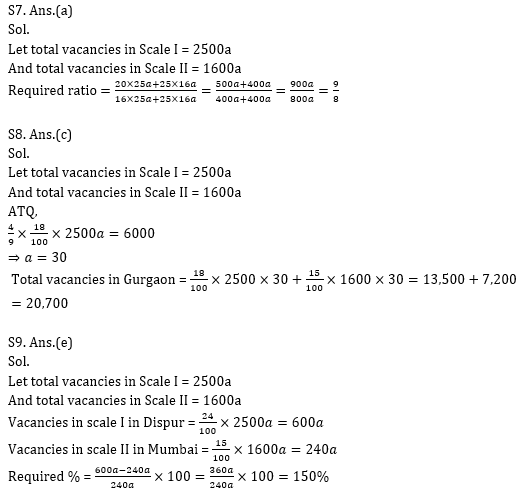
Q7. Find the ratio between Total vacancies in Chennai to total vacancies in Kolkata?
(a) 9 : 8
(b) 23 : 20
(c) 69 : 80
(d) 15 : 16
(e) Cannot be determined
Q8. Vacancies in Scale I in Gurgaon are further divided into three parts i.e. A, B and C in the ratio 2 : 3 : 4. If vacancies in ‘C’ is 6,000 then find total vacancies in Gurgaon in scale I and scale II together?
(a) 19,700
(b) 20,200
(c) 20,700
(d) 21,200
(e) 21,700
Q9. Vacancies in scale I in Dispur are what percent more/less than vacancies in scale II in Mumbai?
(a) Cannot be determined
(b) 100%
(c) 50%
(d) 250%
(e) 150%
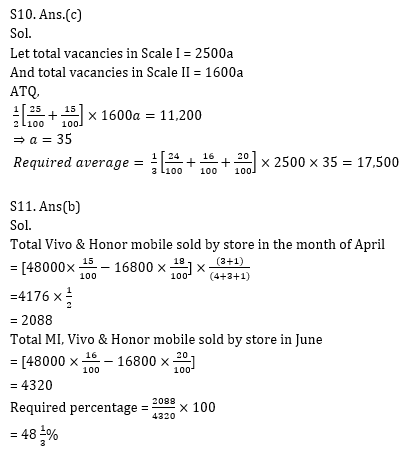
Q10. Find the average vacancies in scale I in Dispur, Kolkata and Chennai all together if average vacancies in scale II in Gurgaon and Kolkata is 11,200
(a) 15,000
(b) 12,500
(c) 17,500
(d) 20,000
(e) 22,500
Directions (11-15): Given below Pie chart (i) shows percentage distribution of total mobile sold by a store during six months, while pie chart (ii) shows percentage distribution of ‘Samsung’ mobile sold by same store during these six months. Read the data carefully and answer the questions.
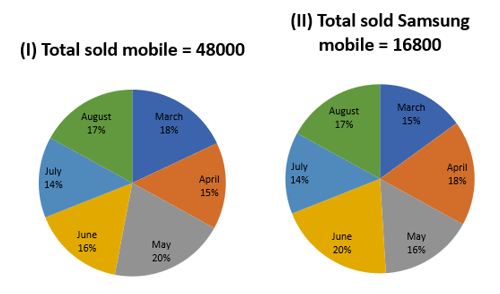
Q11. If store sell only four brands phone i.e. Samsung, MI, Vivo & Honor. Ratio between MI, Vivo & Honor mobile sold by store in April is 4 : 3 : 1. Then find that total Vivo & Honor mobile sold by store in month of April is what percent of total MI, Vivo & Honor mobile sold by store in June?
(a) 42 ⅓%
(b) 48⅓%
(c) 44⅓%
(d) 52⅓%
(e) 54⅓%
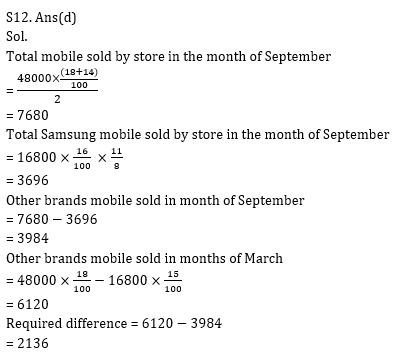
Q12. If total mobile sold by store in the month of September is equal to average number of mobile sold by store in the month of March & July, while total Samsung mobile sold by store in September is 37 ½% more than total Samsung mobile sold by store in May, then find that total other brands (other than Samsung) mobile sold in month of September is how much less than total other brands (other than Samsung) mobile sold in month of March?
(a) 2148
(b) 2156
(c) 2164
(d) 2136
(e) 2172
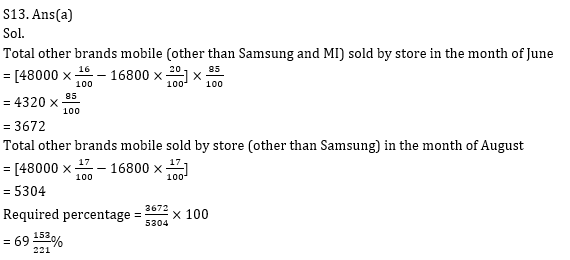
Q13. Out of total other brands mobile (other than Samsung) sold by store in month of June is 15% of mobile are MI brands, then find total other brands (except MI brands and Samsung brand) mobile sold by store in months of June is approximately what % of mobile sold by store in month of august (excluding Samsung mobiles only)?
(a) 69
(b) 65
(c) 60
(d) 55
(e) 75
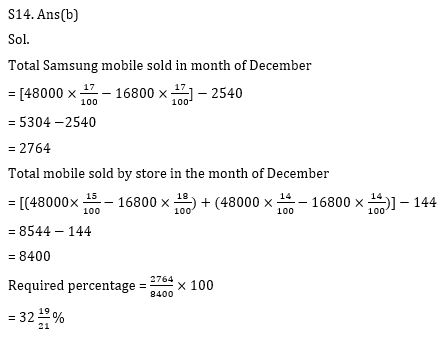
Q14. Total Samsung mobile sold in the month of December is 2540 less than total other brands mobile (other than Samsung) sold by store in August. If total mobile sold by store in the month of December is 144 less than total other brands mobile (other than Samsung) sold by store in the month of April & July together, then find total Samsung mobile sold in the month of December is approximately what percent of total mobile sold by store in that month?
(a) 36%
(b) 32 %
(c) 44%
(d) 24 %
(e) 20 %
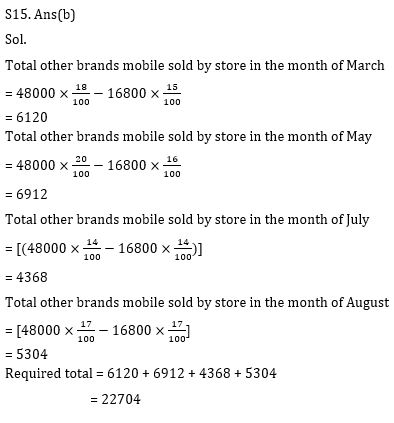
Q15. Find total other brands mobile (other than Samsung) sold by store in the month of March, May, July & August together?
(a) 22804
(b) 22704
(c) 22604
(d) 22504
(e) 22718
Practice More Questions of Quantitative Aptitude for Competitive Exams:
Solutions
Practice with Crash Course and Online Test Series for IBPS PO/RBI Assistant 2020:
- RBI Assistant Mains 2020 Online Test Series
- IBPS PO Online test series (Prelims + Mains) 2020 by Adda247
- IBPS KA MAHAPACK Online Live Classes
Click Here to Register for Bank Exams 2020 Preparation Material


 Daily Current Affairs Quiz 13th May 2026...
 CIL Management Trainee Recruitment 2026 ...
 Union Bank of India Apprentice Recruitme...