
Directions (1-5): Pie chart given below shows percentage distribution on number of students in three streams (Art, Science & commerce) in four colleges. Read the data carefully and answer the questions.
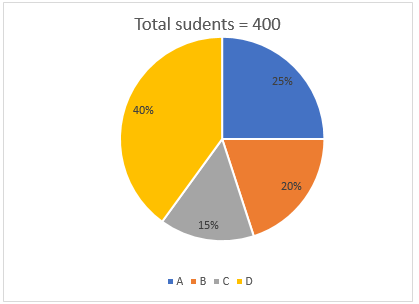
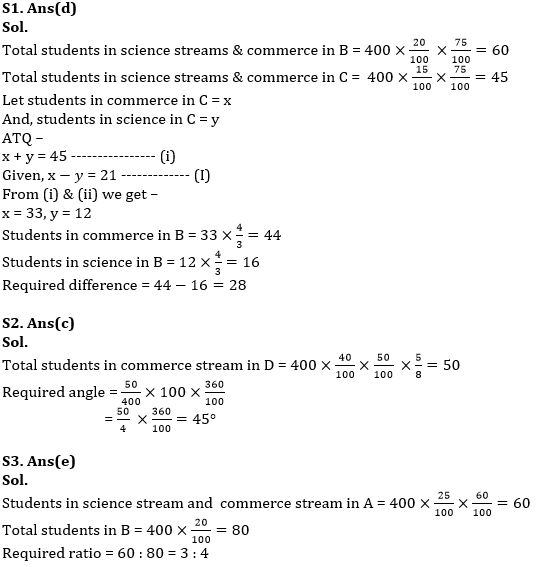
Q1. 25% students from each college B & C are in art streams and students in science streams & commerce in C are 25% less than students in science streams & commerce in B respectively. If students in science streams are 21 less than students in commerce in stream C, then find difference between students in commerce & science stream in B?
(a) 8
(b) 18
(c) 22
(d) 28
(e) 24
Q2. If 50% students in D are in art stream and ratio of students in science stream to commerce stream is 3 : 5, then find central angle for students in commerce stream in D with respect of total students in all four colleges?
(a) 108°
(b) 30°
(c) 45°
(d) 72°
(e) 54°
Q3. If 40% students in A are in art stream, then find ratio of students in science stream and commerce stream in A to total students from B?
(a) 5 : 4
(b) 3 : 7
(c) 3 : 2
(d) 3 : 5
(e) 3 : 4
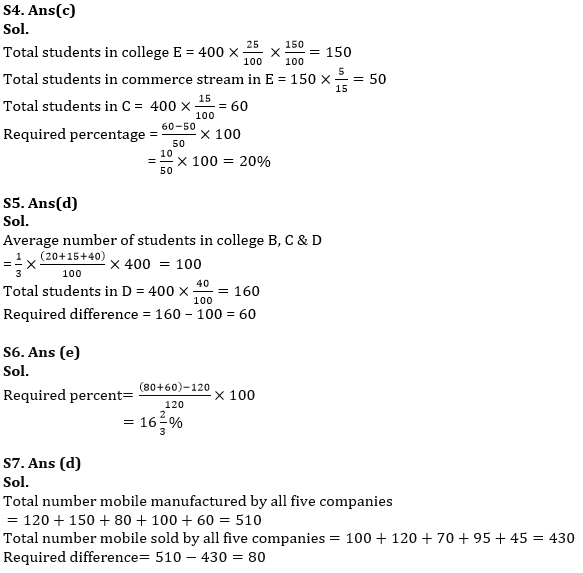
Q4. If total students in college E are 50% more than that of in college A and ratio of students in art, science and commerce stream in E is 7 : 3 : 5, then find total students in college C is what percent more than total students in commerce stream in E?
(a) 12.5%
(b) 10%
(c) 20%
(d) 25%
(e) 15%
Q5. Find difference between average number of students in college B, C & D & total students in D?
(a) 105
(b) 75
(c) 45
(d) 60
(e) 40
Directions (6-10): Read the following bar graph carefully and answer the questions given below. The following bar graph shows number of mobile manufactured and sold by five different companies.
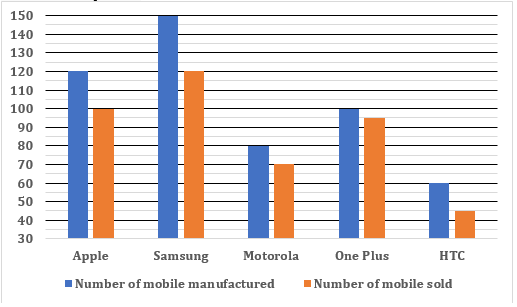
Q7. Find the difference between total number of mobile manufactured by all five companies and the total number of mobile sold by all five companies.
(a) 40
(b) 60
(c) 120
(d) 80
(e) 100
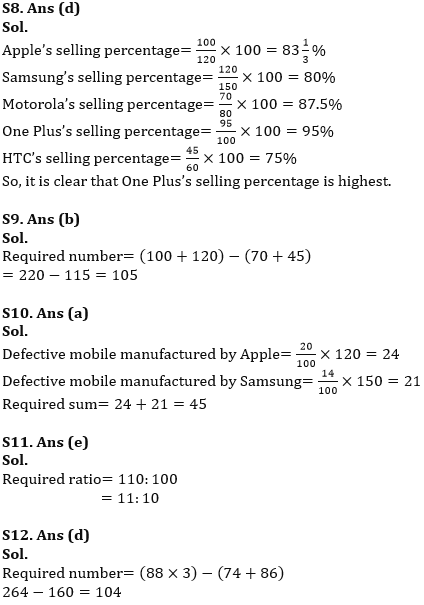
Q8. Which of the company have highest selling percentage among all the five companies?
(a) Motorola
(b) Apple
(c) HTC
(d) One Plus
(e) Samsung
Q9. Number of mobile sold by Motorola & HTC together are how much more/less than number of mobile manufactured by Apple & One Plus together?
(a) 112
(b) 105
(c) 109
(d) 102
(e) 118
Q10. If 20% of mobile manufactured by Apple are defective and 86% of mobile manufactured by Samsung are non-defective, then find the defective phones manufactured by Apple & Samsung together?
(a) 45
(b) 25
(c) 50
(d) 30
(e) 75
Directions (11-15): Read the following line chart carefully and answer the questions given below. Following the line chart shows number of Tigers in two national reserve(A &B) in five different years 2015, 2017, 2018, 2019 and 2021.
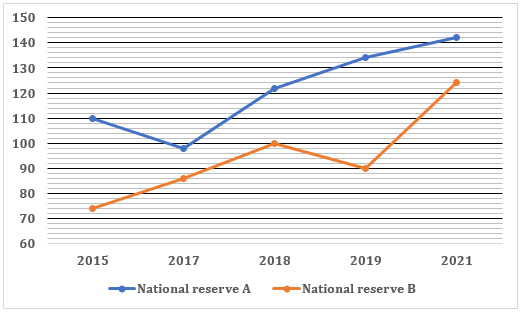
Q11. Find the respective ratio of number of Tigers in national reserve A in 2015 to that of B in 2018?
(a) 7:10
(b) 7:9
(c) 9:7
(d) 10:11
(e) 11:10
Q12. If the average number of Tigers in 2015, 2016 and 2017 in national reserve B is 88, then find the total number of Tigers in national reserve B in 2016
(a) 110
(b) 80
(c) 96
(d) 104
(e) 122
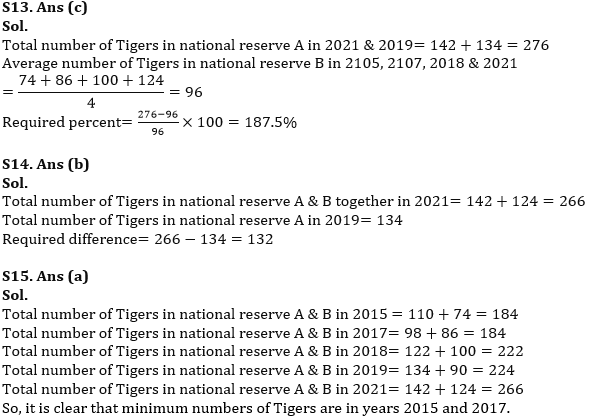
Q13. Number of Tigers in national reserve A in 2021 & 2019 together are what percentage more/less than the average number of Tigers in national reserve B in 2015, 2017, 2018 and 2021 together?
(a) 127.5%
(b) 151.5%
(c) 187.5%
(d) 212.5%
(e) 245.4%
Q14. Number of Tigers in national reserve A & B together in 2021 is how much more/less than total number of Tigers in national reserve A in 2019?
(a) 105
(b) 132
(c) 125
(d) 115
(e) 145
Q15. In which years number of Tigers taken together in both the national reserves are minimum?
(a) 2015 & 2017
(b) 2018 & 2021
(c) None of these
(d) 2015
(e) 2109
Solutions


 Data Interpretation Questions for IBPS R...
 Data Interpretation Questions For Bank E...
 Data Interpretation Questions for SBI PO...


