

Directions (1-5): The data given below shows the distribution of employees of two companies X and Y in three departments viz. Administration, HR and others.
Total employees in company X and Y together are 5600 and the ratio of employees in company X and Y is 4 :3.
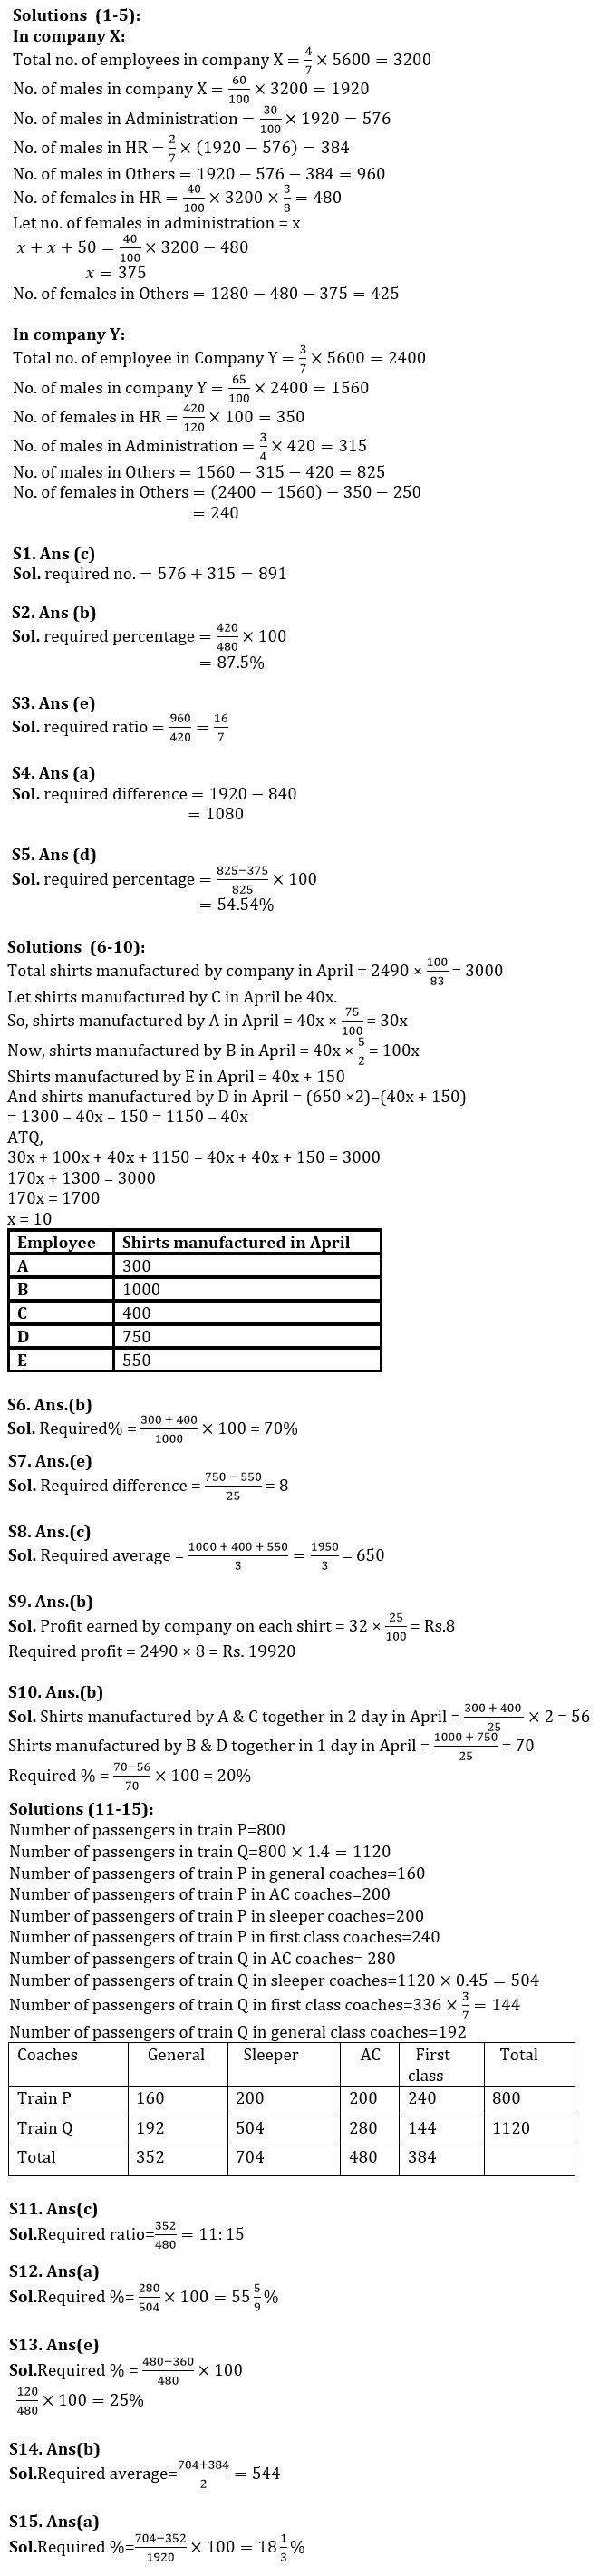
In company X – No. of male employees are 60%. No. of males working in administration are 30% of total males. Ratio of males working in HR and others is 2 :5. ⅜ th of total females are working in HR and no. of females working in Administration are 50 less than females working in others.
In company Y – No. of male employees are 65%. Total 420 males work in HR department, which is 120% of the females working in HR. No. of males working in Administration are ¾ th of males in HR. 250 females works in Administration.
Q1. What is the no. of male employees working in Administration department of company X and Y together?
(a) 981
(b) 971
(c) 891
(d) 881
(e) 871
Q2. Male employees in HR department of company Y is what percent of female employee in HR department of company X?
(a) 115%
(b) 87.5%
(c) 92%
(d) 110%
(e) 85%
Q3. Find the ratio between male employee in Others of company X and male employee in HR of company Y.
(a) 7/16
(b) 15/8
(c) 16/9
(d) 8/15
(e) 16/7
Q4. What is the difference between no. of males in company X and no. of females in company Y?
(a) 1080
(b) 1240
(c) 960
(d) 880
(e) 1020
Q5. No. of females in Administration in company X is what percent more/less than no. of males in Others in company Y?
(a) 120%
(b) 90%
(c) 64%
(d) 54.54%
(e) 50.5%
Directions (6-10): Read the passage given below and answer the following questions.
A company which has only 5 employees, i.e. A, B, C, D & E, manufactures shirts. Company sold 2490 shirts in April, which is 83% of the total shirts manufactured by the company in April. Shirts manufactured by A in April is 75% of the shirts manufactured by C in April. Ratio of shirts manufactured in April by B & C is 5 : 2. Average number of shirts manufactured in April by D & E is 650. Shirts manufactured by C in April are 150 less than shirts manufactured by E in April. Each employee of the company worked for 25 days in April.
Q6. Shirts manufactured by A & C together in April are what percent of shirts manufactured by B in April.
(a) 20%
(b) 70%
(c) 40%
(d) 30%
(e) 60%
Q7. Shirts manufactured by D in 1 day in April are how much more or less than shirts manufactured by E in 1 day in April?
(a) 9
(b) 5
(c) 2
(d) 7
(e) 8
Q8. Find the average number of shirts manufactured by B, C & E in April.
(a) 350
(b) 500
(c) 650
(d) 600
(e) 400
Q9. If cost of manufacturing a shirt in April is Rs.32 and company sold each shirt at 25% profit in April, then find the total profit earned by the company on sold shirts in April.
(a) Rs.12640
(b) Rs.19920
(c) Rs.20480
(d) Rs.17560
(e) Rs.14540
Q10. Shirts manufactured by A & C together in 2 days in April are what percent more or less than shirts manufactured by B & D together in 1 day in April?
(a) 60%
(b) 20%
(c) 40%
(d) 50%
(e) 30
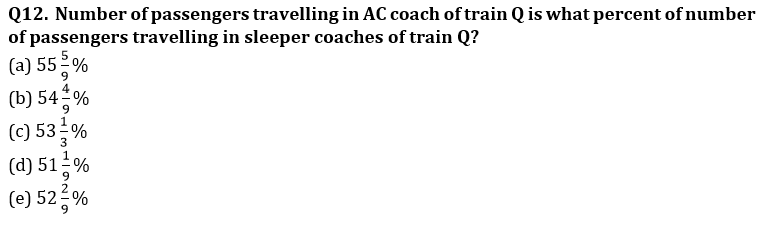
Directions (11-15): Read the given information carefully and answer the following question.
There are two trains P and Q. Both trains have four different types of coaches i.e. General, sleeper class, first class and AC coaches. In train P, there are total 800 passengers. Train Q has 40% more passengers than train P. 20% of the passengers of train P are in general coaches. One‐fourth of the total number of passengers of train P are in AC coaches. 25% of the passengers of train P are in sleeper class coaches. Remaining passengers of train P are in first class coaches. Total number of passengers in AC coaches in both the trains together is 480. 45% of the number of passengers of train Q is in sleeper class coaches and ratio of passengers of train Q in first class coaches to general class coaches is 3:4.
Q11. What is the ratio of total number of passengers travelling in general coaches to the total number of passengers travelling in AC coaches of both the trains?
(a) 8:15
(b) 3:5
(c) 11:15
(d) 22:25
(e) 5:9
Q13. Total number of passengers of train P who are travelling in General and Sleeper coaches together are what percent more or less than the total number of passengers of both the trains travelling in AC coaches?
(a) 22.5%
(b) 20%
(c) 15%
(d) 30%
(e) 25%
Q14. Find the average number of passengers travelling in sleeper and first class coaches of both trains?
(a) 524
(b) 544
(c) 562
(d) 574
(e) 580
Q15. Difference of passengers travelling in General and Sleeper coaches of both the trains is what percent of total passengers travelling in both the trains?
(a) 18 ⅓%
(b) 17 ½ %
(c) 16 ⅔%
(d) 22 ½ %
(e) 20%
Solutions


 HPSCB Junior Clerk Exam Date 2026, Check...
 DSSSB IT Assistant Vacancy 2026 Notifica...
 SBI SCO Recruitment 2026, Last Date to A...


