
50+ Important DI Questions for SIDBI Grade A 2022 Exam: DI is the most weighted and time-consuming topic in quantitative aptitude. Every competitive examination consists of questions from this topic. As you know, SIDBI Grade-A Exam is scheduled to be held on 16th April 2022, and candidates are left with only a few days to prepare for this examination. Date Interpretation questions will be important topics that play a vital role in the upcoming SIDBI Grade A 2022 exam. In this article, we are providing you with 50+ Important DI questions for the upcoming SIDBI Grade A 2022 exam, which will help you uplift your preparation for the examination, so keep reading.
Click here to download SIDBI Grade A Admit Card 2022
50+ Important DI Questions for SIDBI Grade A 2022 Exam
The quantitative Aptitude Section is challenging and trickiest of all. This section includes Data Interpretation(DI) which is time-consuming and requires the candidates to be very accurate with their answers. If prepared well the candidates can ensure good marks from the quantitative aptitude section. The best way to Prepare for the DI(Data Interpretation) questions is by practicing more and more questions. The maximum number of questions are asked from the Data Interpretation and it also contains more weightage. Preparing this section can help the students stretch their overall marks and qualify for the SIDBI Grade A 2022 exam. Given below are the various types of formats in which DI questions are been asked in the examination.
SIDBI Grade A Syllabus And Exam Pattern 2022
![]()
50+ Important DI Questions for SIDBI Grade A 2022 Exam
Direction (1-5): The date given below shows the number of girls in six different schools. Some data is given in absolute value while some in percentage. Study the data carefully and answer the following questions.
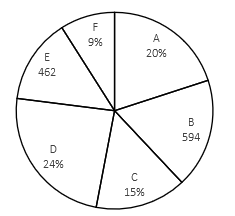
Q1. Find the central angle of girls in school B?
(a) 57.6°
(b) 64.8°
(c) 72°
(d) 79.2°
(e) 86.4°
Q2. The total number of girls in school ‘D’ is how much more than the total number of girls in school ‘E’?
(a) 264
(b) 297
(c) 330
(d) 363
(e) 396
Q3. Find the total number of girls in school ‘A’ and ‘D’ together?
(a) 1364
(b) 1386
(c) 1408
(d) 1430
(e) 1452
Q4. If the ratio between number of girls and number of boys in school ‘F’ is 9 : 8, then find total number of students in school ‘F’.
(a) 561
(b) 550
(c) 528
(d) 539
(e) 572
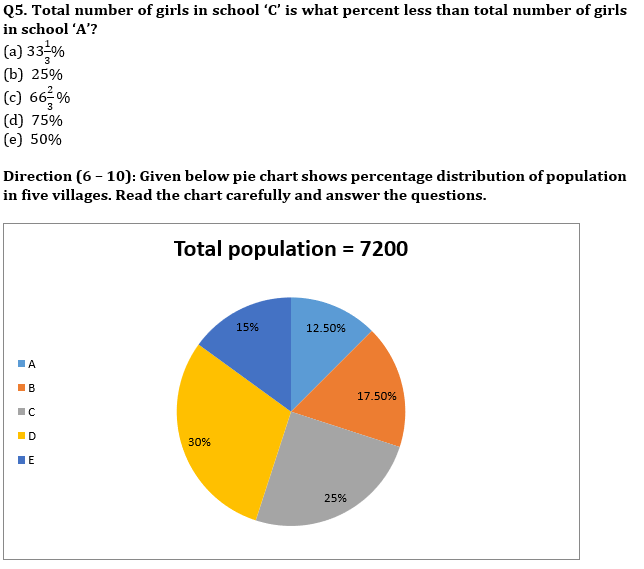
Q7. Find the central angle of the population of villages D & E together?
(a) 148°
(b) 154°
(c) 166°
(d) 160°
(e) 162°
Q8. If total population of another village Q is 65 % of total population of village C and ratio between male population to female population in village Q is 4 : 9. Then find total female population in village Q?
(a) 805
(b) 810
(c) 840
(d) 880
(e) 960
Q9. If total literate population of village D is equal to 75 % of total population of village B. then find percentage of illiterate population in village D?
(a) 54.25%
(b) 52 .25%
(c) 58.25%
(d) 56.25 %
(e) 50.25%
Q10. Find the ratio between total population of village E to total population of village B?
(a) 5 : 7
(b) 6 : 11
(c) 6 : 7
(d 6 : 5
(e) 5 : 12
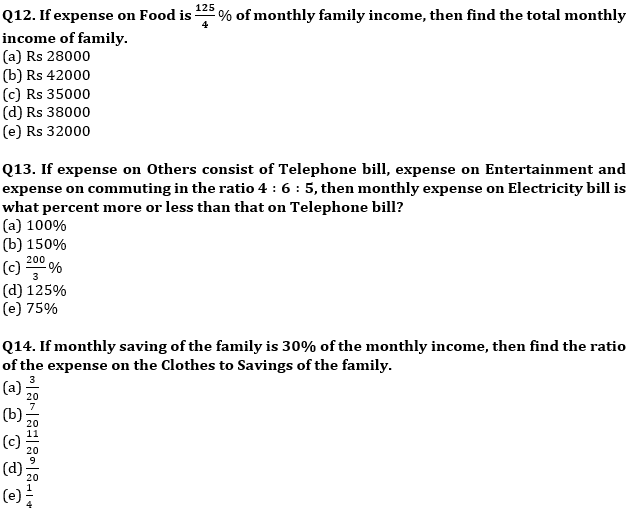
Directions (11-15): The given pie chart shows the percentage distribution of various expenses of a family in a given month.
Study the graph carefully and answer the following questions.
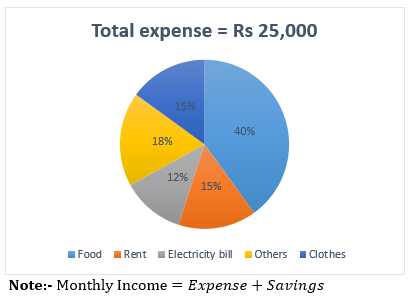
Q11. What is the average expense on Rent, Electricity bill and Others?
Rs 5000
Rs 3000
Rs 3750
Rs 2750
Rs 3250
Q15. Find central angle (in degrees) of monthly expense of family on electricity bill.
(a) 76.4
(b) 68.6
(c) 32.8
(d) 54.6
(e) 43.2
Directions (16-18): Study the table given below and answer the following questions.
The table shows the number of girls in 5 different schools (A, B, C, D & E) and ratio of boys & girls in these schools.
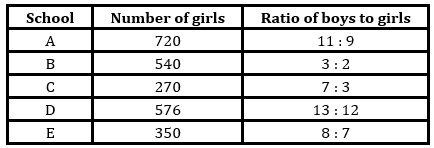
Q16. Find ratio of boys in school – A & E together to boys in school – B & C together.
(a) 3 : 5
(b) 11 : 14
(c) 8 : 9
(d) 1 : 2
(e) 6 : 11
Q17. Average number of girls in school – B, C & D is what percent of average number of students in school – A & D?
(a) 50%
(b) 15%
(c) 35%
(d) 20%
(e) None of the above.
Q18. Students in school – B are how much more than girls in school – E and boys in the school – D together?
(a) 388
(b) 382
(c) 394
(d) 376
(e) 374
Directions (19-23): Pie chart given below shows the percentage break up of revenue generated by six different items (LED, refrigerator, cable, laptops, mobile and calculator) of a shop in a month? (assume the shop sell only these six items)
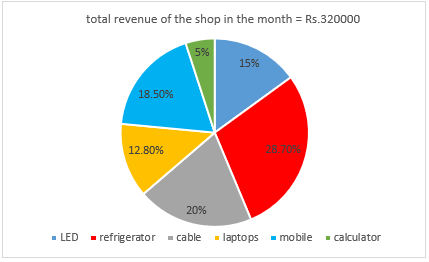
Q19. Revenue from refrigerator is how much more than revenue from laptops?
(a) Rs.40960
(b) Rs.64000
(c) Rs.59200
(d) Rs.50880
(e) Rs.48000
Q20. What is the difference between central angle (in degree) formed by revenue from refrigerator, laptops and mobile together and revenue from cable?
(a) 144
(b) 108
(c) 72
(d) 180
(e) 240
Q21. Revenue from mobile is how much percent more than revenue from calculator?
(a) 370%
(b) 225%
(c) 250%
(d) 275%
(e) 270%
Q22. If total 4 LED were sold in that month and the selling price of each laptop in that month is Rs.5120, find no. of laptop sold is how much percent more than no. of LED sold in that month?
(a) 50%
(b) 100%
(c) 25%
(d) 75%
(e) 200%
Q23. What is the total revenue (in Rs.) from cable and mobile together?
(a) 223100
(b) 123000
(c) 123200
(d) 148200
(e) None of these.

Directions (24-28): Table given below gives information about no. of students who appeared for a banking exam in a lab in three different shifts of five days. Read the data carefully and answer the following questions?
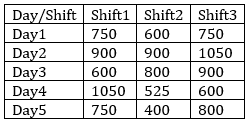
Q24. No. of students appeared on shift1 and shift2 together on day2 are how much percent more or less than no. of students appeared in shift3 on day1 and day3 together?
(a) 11.11%
(b) 9.09%
(c) 8.25%
(d) 11.33%
(e) 9.11%
Q25. If 40% of students appeared in shift2 of day4 are girls, find no. of boys appeared in shift2 of day4 are how much less than students appeared in same shift of day5?
(a) 190
(b) 105
(c) 85
(d) 90
(e) 120
Q26. What is the average no. of students appeared in shift3 of all five days?
(a) 800
(b) 820
(c) 810
(d) 815
(e) 805
Q27. If 0.4% and 0.75% of students appeared on shift1 and shift3 of day1 and day5 respectively cleared the exam, find ratio of students who cleared exam in shift3 of day5 to that of in shift1 of day1?
(a) 1:2
(b) 3:2
(c) 4:3
(d) 2:3
(e) 2:1
Q28. No. of students appeared in shift2 of day4 are how much percent of no. of students appeared in shift3 of the same day?
(a) 45%
(b) 87.5%
(c) 62.5%
(d) 75%
(e) 60%
Directions (29-33): Study the pie-charts carefully and answer the following questions.
1st Pie-chart shows the percentage distribution of AC (split AC + window AC) and 2nd pie-chart shows the percentage distribution of Split AC sold by four different stores (X, Y, Z and K)
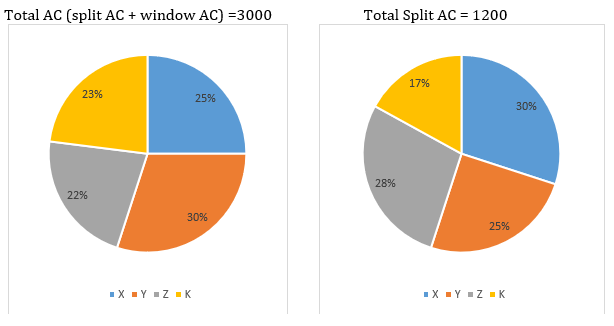
Q29. Total AC sold by Store X is what percent more or less than the window AC sold by store Y?
(a)25%
(b) 35%
(c) 30%
(d) 20%
(e) 40%
Q30. What is the ratio of total AC (split + window) sold by store Z to window AC sold by store X?
(a)22:17
(b) 22:13
(c) 21: 17
(d) 21:13
(e) None of these
Q31. Window AC sold by store K is what percent of the total AC (split + window) sold by all store together?
(a)14.4%
(b) 26%
(c) 19%
(d) 16.2%
(e) 12.5%
Q32. If store Y sold each window AC at Rs 28000 then find the total money obtained by store Y by selling all the window AC?
(a) 2.48 crore
(b) None of these
(c) 16.8 lakh
(d) 1.68 lakh
(e) 1.68 crore
Q33. What is the average of split AC sold by store X, Y and K?
(a) 148
(b) 288
(c) 248
(d) 242
(e) 324
Direction (34-38): Given below table shows total three types of items (A, B & C) sold by a store on five days of a week. The table also shows total type A items sold by store and percentage of items B and items C sold by store. Read the data carefully and answer the following questions:
Note- only three types of items sold by the store.
| Days | Items A | % of items B | % of items C |
| Monday | 240 | 32% | 20% |
| Tuesday | 320 | 48% | 12% |
| Wednesday | 420 | 45% | 20% |
| Thursday | 360 | 56% | 20% |
| Friday | 340 | 22% | 10% |
Q34. Total items B sold by the store on Monday & Friday together are what percent less than total items C sold by store on Wednesday & Thursday together?
(a) 60%
(b) 50%
(c) 20%
(d) 30%
(e) 10%
Q35. Find the difference between average number of items B sold by store on Tuesday & Thursday and average number of items A sold by store on Thursday & Friday?
(a) 260
(b) 264
(c) 262
(d) 272
(e) 268
Q36.If total items B sold by store on Sunday is 25% more than that sold on Thursday and total items C sold on Sunday is 300% more than that sold on Friday, then find the total number of items B&items C sold by store on Sunday?
(a) 1250
(b) 1150
(c) 1050
(d) 950
(e) 1350
Q37. Total items C sold by store on Wednesday is what percent more than total items C sold by store on Monday and Tuesday together?
(a) 26
(b) 24
(c) 22
(d) 21
(e)
Q38. Find the ratio between total items sold by the store on Monday to total items sold by store on Thursday?
(a) 1 : 5
(b) 1 : 3
(c) 1 : 7
(d) 1: 4
(e) 1 : 2
Directions (39-44): Given table provides the rate of interest on a certain sum in 1st, 2nd, 3rd & 4th year. All calculations are to be done as per compound interest compounding annually. Some data are missing which you have to find using the information provided in the question.
Study the data carefully and answer the questions.
| Year | Sum (in Rs.) | |||
| 0-2000 | 2000-4000 | 4000-6000 | 6000-8000 | |
| 1st | 5% | 5% | 5% | – |
| 2nd | 5% | – | 10% | 10% |
| 3rd | 10% | 10% | – | – |
| 4th | – | 15% | – | 20% |
Q39. What will be the interest on a sum of Rs. 1500 for 3 years?
(a) Rs. 300
(b) Rs. 180
(c) Rs. 375
(d) Rs. 319.125
(e) Rs. 325
Q40. If the interest earned on a sum of Rs. 5000 in 3 years is Rs. 2000. Find the interest rate for 3rd year. (approx.)
(a) 21%
(b) 23%
(c) 19%
(d) 25%
(e) 27%
Q41. Akshay invested Rs. 8000 in a scheme offering interest as mentioned in table. After 3 years he get Rs. 10626. If schemes has provided third year interest rate as 15% pa, then find the rate for 1st year.
(a) 3%
(b) 4%
(c) 5%
(d) 6%
(e) 10%
Q42. What is the ratio of the amount received on a sum of Rs. 3000 for 3 years (if 2nd-year rate of interest is same as 3rd-year rate of interest) to the amount received on a sum of Rs. 5000 for 3 years (if 3rd-year rate of interest is 50% more than that of 2nd year)?
(a) 33:115
(b) 22:115
(c) 3:5
(d) 22:23
(e) 66:115
Q43. The ratio of the amount received on investing Rs. 8000 for 2 years and 3 years is 5:6. Find the rate of interest for 3rd year.
(a) 15%
(b) 20%
(c) 25%
(d) Cannot be determined
(e) None of these
Directions (44-48): Study the passage given below carefully and answer the following questions.
In a school, there are total of 243 students in 5 classes (i.e. class – I, II, III, IV & V). Students in Class – IV are 50% more than students in Class – II and students in Class – III are 10 more than students in Class – II. Students in Class – V are 80% of students in Class – IV and ratio of students in Class – I to that of in Class – V is 15 : 16.
Q44. If ratio of boys to girls in Class – I & IV is 3 : 2 and 8 : 7 respectively, then find the number of girls in Class – I & IV together is what percent of total students in Class – II?
(a) 115%
(b) 130%
(c) 120%
(d) 135%
(e) 125%
Q45. If ratio of students who play basketball, football and cricket in Class – III & V is 2 : 1 : 2 and 2 : 3 : 3 respectively, then find ratio of students who play football in these 2 classes together to students who play cricket in these two classes together.
(a) 11 : 9
(b) 1 : 1
(c) 7 : 4
(d) 6 : 1
(e) None of the above.
Q46. If ratio of girls to boys in Class – II is 2 : 3 and average weight of boys in Class – II is 40kg and average weight of girls in Class – II is 25kg, then find the average weight of Class – II.
(a) 33 kg
(b) 34 kg
(c) 37 kg
(d) 36 kg
(e) 35 kg
Q47. Find average number of students in Class – II, III & V.
(a) 52
(b) 46
(c) 45
(d) 42
(e) 49
Q48. If total students in Class – VI are equal to 150% of average number of students in Class – II & V, then find difference between total students in Class – VI and total students in Class – IV.
(a) 18
(b) 9
(c) 12
(d) 6
(e) 15
Directions (49-53) Following line Graph given provides the details of total number of rides taken by 3 different drivers in 5 different months and the Table DI given below provides the details of percentage of total female rides taken by all the drivers in 5 different months and answer the questions accordingly.
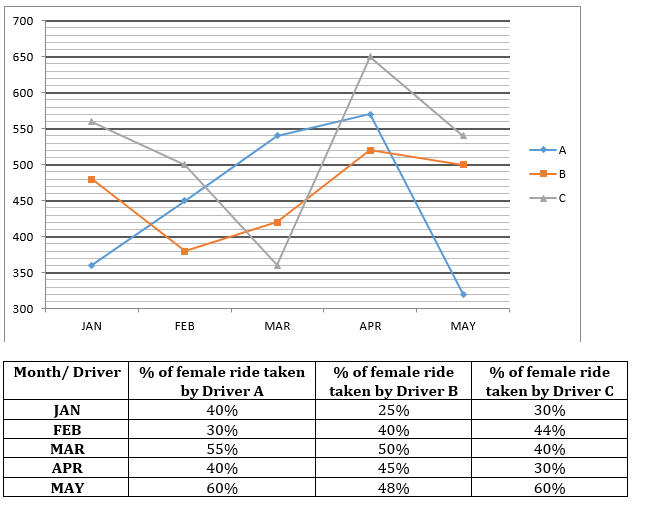
Q49. Total number of male rides taken by Driver B in January and March together is approximately what percentage more than the total female rides taken by driver A in April and may together?
(a) 40%
(b) 36%
(c) 45%
(d) 30%
(e) 50%
Q50. Find the total number of male rides taken by all the three drivers in March together?
(a) 652
(b) 724
(c) 696
(d) 669
(e) 628
Q51. Find the difference between total number of female ride taken by all the 3 drivers in January to the total number of male rides taken by all the 3 drivers in march?
(a) 327
(b) 294
(c) 268
(d) 214
(e) 237
Q52. Find the respective ratio of total number of female rides taken by driver A in April and May together to the total number of male ride taken by Driver B in January and march together?
(a) 14:19
(b) 17:23
(c) 18:23
(d) 19:14
(e) 23:17
Q53. Find the total number of female rides taken by Driver B in all the five months together?
(a) 848
(b) 956
(c) 984
(d) 918
(e) 884
Solutions
Candidates can check the solutions of all the DI questions mentioned above from the table mentioned below.
| Question Number | Correct Options |
| 1. | B |
| 2. | C |
| 3. | E |
| 4. | A |
| 5. | B |
| 6. | A |
| 7. | E |
| 8. | B |
| 9. | D |
| 10. | C |
| 11. | C |
| 12. | E |
| 13. | B |
| 14. | B |
| 15. | E |
| 16. | B |
| 17. | C |
| 18. | E |
| 19. | D |
| 20. | A |
| 21. | E |
| 22. | B |
| 23. | C |
| 24. | B |
| 25. | C |
| 26. | B |
| 27. | E |
| 28. | B |
| 29. | A |
| 30. | B |
| 31 | D |
| 32 | E |
| 33 | B |
| 34 | B |
| 35 | C |
| 36 | A |
| 37 | C |
| 38 | B |
| 39 | D |
| 40 | A |
| 41 | C |
| 42 | E |
| 43 | B |
| 44 | A |
| 45 | E |
| 46 | B |
| 47 | B |
| 48 | D |
| 49 | B |
| 50 | D |
| 51 | E |
| 52 | A |
| 53 | B |


 Puzzle Questions for SBI PO Exam
 LIC HFL Admit Card 2026 Out, Steps to Do...
 Daily Current Affairs and GK Updates (5t...

