

Directions (1-5) :- The given bar graph shows the total no. of students of 5 different schools and no. of boys from each school.
Study the graph carefully and answer the following questions.
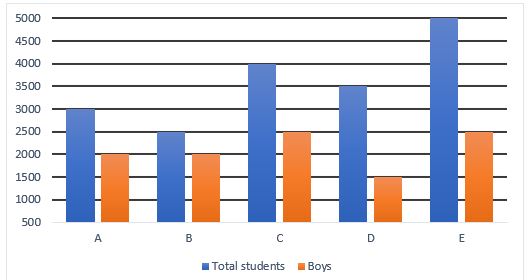
Q1. What is the ratio between no. of boys of school B and no. of girls of school C?
(a) 4 :3
(b) 1 :1
(c) 5 :4
(d) 3 :4
(e) 4 :5
Q2. No. of girls of school B and C together is what percent of total students of school A?
(a) 150%
(b) 125%
(c) 100%
(d) 66.67%
(e) 75%
Q3. What is the average no. of boys in school A, B, C and E?
(a) 1800
(b) 2250
(c) 2300
(d) 1950
(e) 2875
Q4. Girls in school A and B together are what percent more/less than girls of school B and D together?
(a) 60%
(b) 50%
(c) 40%
(d) 70%
(e) 80%
Q5. No. of boys in school B and E together are how much more/less than girls in school A, C and D together?
(a) 500
(b) 1000
(c) 1500
(d) 2000
(e) 0
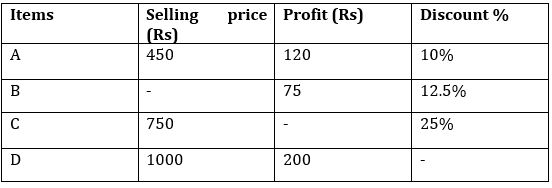
Directions (6-10) :- The data in the table given below shows the selling price, profit obtained and discount percentage on 4 items of a store. Some data are missing in this table and you have to calculate missing data according to the questions.
Study the data carefully and answer the following questions.
Q6. What is the marked price of the article A?
(a) Rs 540
(b) Rs 460
(c) Rs 500
(d) Rs 600
(e) Rs 480
Q7. What is the selling price of the article B, if marked price of article B is 20% above the cost price?
(a) Rs 1775
(b) Rs 1500
(c) Rs 1850
(d) Rs 1625
(e) Rs 1575
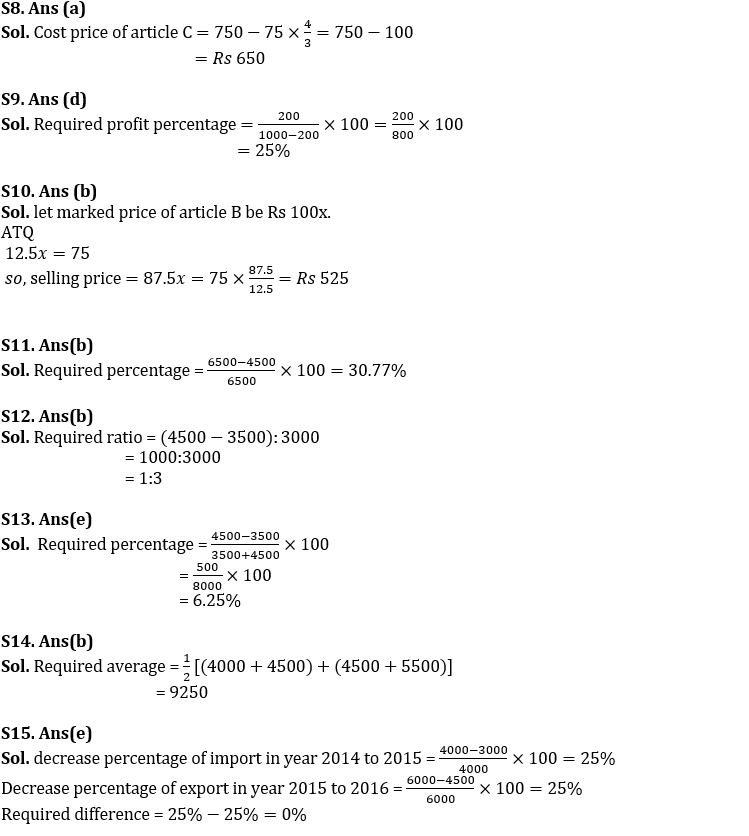
Q8. If ratio between profit earned on article B and article C is 3 : 4, find the cost price of article C?
(a) Rs 650
(b) Rs 600
(c) Rs 680
(d) Rs 700
(e) Rs 600
Q9. Find the profit percentage earned on article D?
(a) 20%
(b) 22.5%
(c) 15%
(d) 25%
(e) 17.5%
Q10. If profit amount on article B and discount amount of article B is same, then find the selling price of article B?
(a) Rs 450
(b) Rs 525
(c) Rs 625
(d) Rs 575
(e) Rs 475
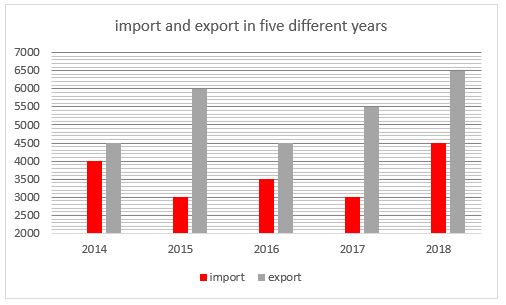
Directions (11-15): – Bar graph given below shows import and export of a company in five different years. Read the data carefully and answer the following questions.
Q11. Maximum import in any of the given years is how much percent less than maximum export in any of the given year? (right up to 2 decimal places)
(a) 20.17%
(b) 30.77%
(c) 25.67%
(d) 16.67%
(e) 20.85%
Q12. What is the ratio of difference between export and import in year 2016 to import in year 2015?
(a) 1:2
(b) 1:3
(c) 2:3
(d) 4:5
(e) None of these.
Q13. Difference between export and import in year 2014 is what percent of import in year 2016 and 2018 together?
(a) 12.5%
(b) 25%
(c) 9%
(d) 16.67%
(e) 6.25%
Q14. What is the average of import in 2014 and 2018 together and export in 2016 and 2017 together?
(a) 7250
(b) 9250
(c) 8750
(d) 6250
(e) None of these.
Q15. What is the difference between decrease percentage of import from year 2014 to 2015 and decrease percentage in export from year 2015 to 2016?
(a) 10%
(b) 2%
(c) 5%
(d) 4%
(e) 0%
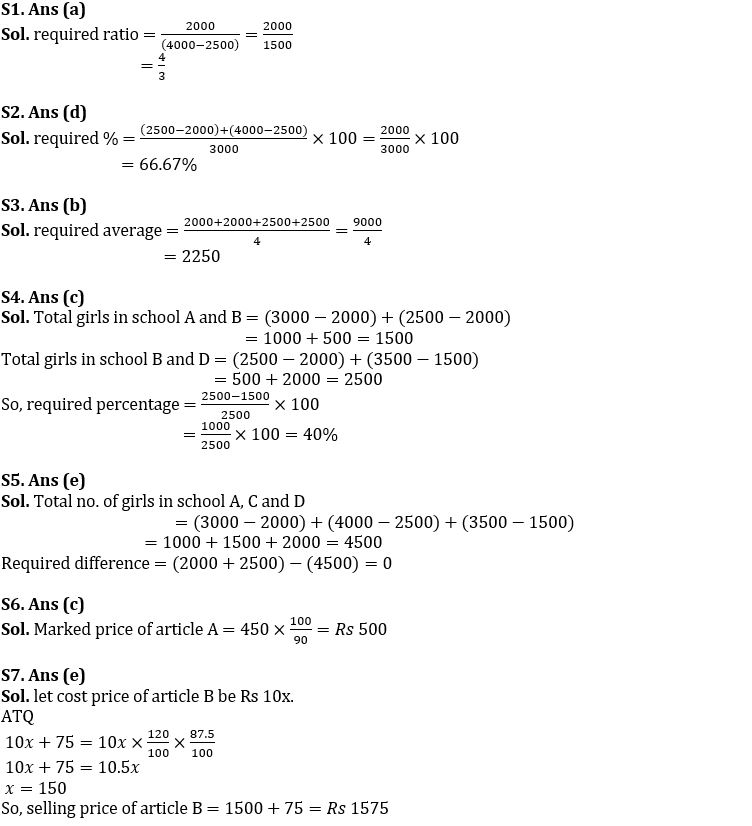
Solutions


 FCI Assistant Grade 3 Previous Year Ques...
 FCI Manager Previous Year Question Paper...
 FCI DV Admit Card 2023 Out, Download FCI...


