

Directions (1-5): pie chart given below gives information about distribution of voters in six different cities out of total voters.
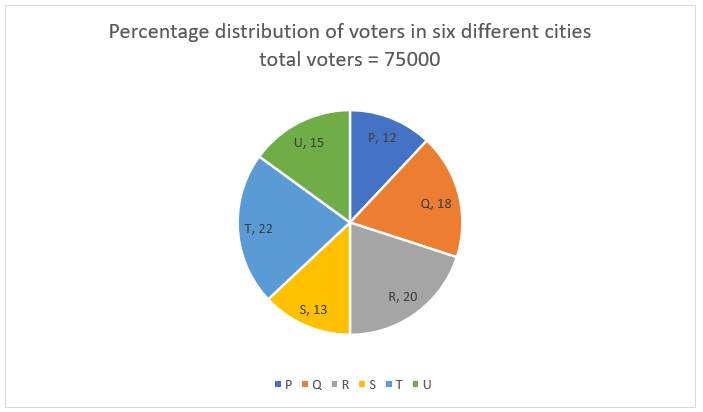
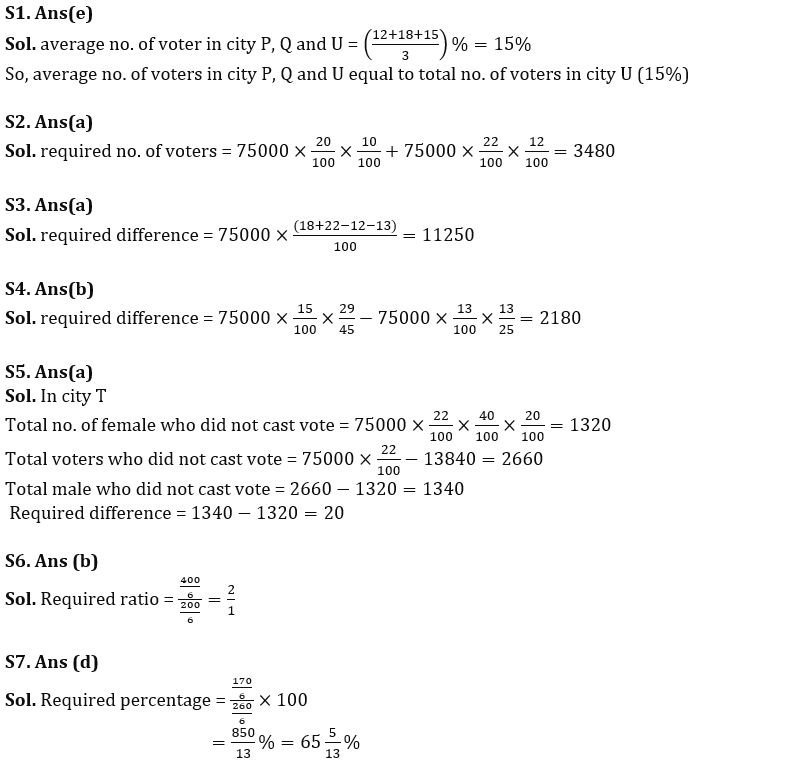
Q1. Average no. of voters in city P, Q, and U are equal to total no. of voters of which city?
(a) P
(b) Q
(c) S
(d) T
(e) U
Q2. If 90% and 88% of total voters of city R and T respectively voted on the day of voting, then find no. of voters who did not vote in these two cities?
(a) 3480
(b) 2280
(c) 2440
(d) 2240
(e) 3280
Q3. What is the difference between total voters of city P and S together to total voters of city Q and T together?
(a) 11250
(b) 9750
(c) 9000
(d) 16500
(e) 15000
Q4. If ratio of male voters to female voters in city S and city U is 13:12 and 29:16 respectively, then find difference between no. of male voters in these cities?
(a) 2050
(b) 2180
(c) 3400
(d) 3140
(e) None of these.
Q5. If in city T 40% of total voters are female and 20% of female voters did not cast vote and total 13840 vote were polled, then find how difference of male and female who did not cast vote?
(a) 20
(b) 40
(c) 25
(d) 15
(e) 38
Direction (6-10) :- Line graph given below shows distance (in km) covered by Truck A and Truck B on five different days. Study the data carefully and answer the following questions.
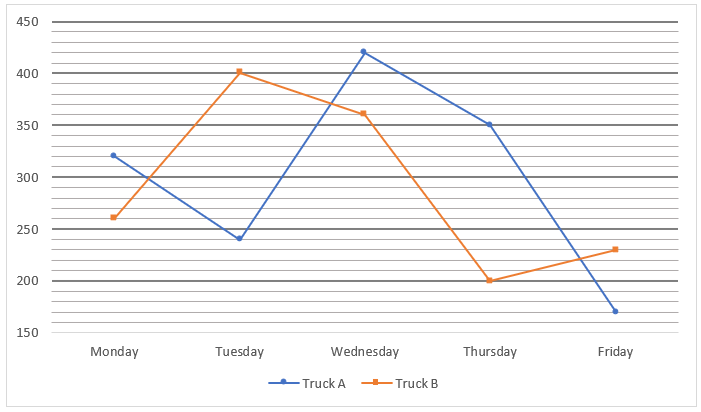
Note – Both truck travel 6 hours a day.
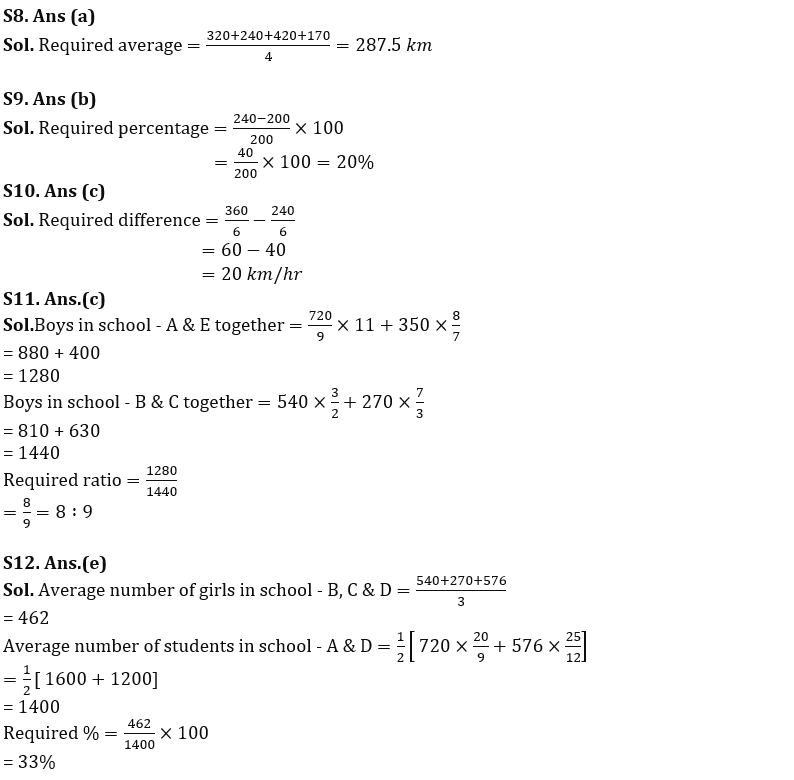
Q6. Find the ratio between average speed of Truck B on Tuesday to that of Truck B on Thursday.
(a) 1 : 3
(b) 2 : 1
(c) 1 : 2
(d) 4 : 1
(e) 3 : 2
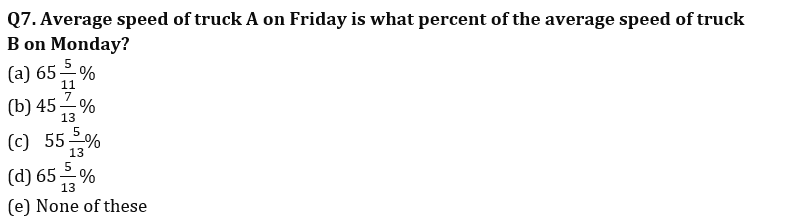
Q8. Find the average distance travelled by truck A on all days except Thursday?
(a) 287.5 km
(b) 293.5 km
(c) 269.5 km
(d) 274.5 km
(e) 282.5 km
Q9. Distance travelled by truck A on Tuesday is how much percent more or less than distance travelled by truck B on Thursday?
(a) 15%
(b) 20%
(c) 30%
(d) 25%
(e) None of these
Q10. Find the difference between average speed of truck A on Tuesday and average speed of truck B on Wednesday?
(a) 30 km/hr
(b) 24 km/hr
(c) 20 km/hr
(d) 36 km/hr
(e) 18 km/hr
Directions (11-15): Study the table given below and answer the following questions.
Table shows the number of girls in 5 different schools (A, B, C, D & E) and ratio of boys & girls in these schools.
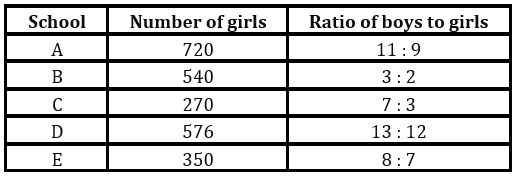
Q11. Find ratio of boys in school – A & E together to boys in school – B & C together.
(a) 3 : 5
(b) 11 : 14
(c) 8 : 9
(d) 1 : 2
(e) 6 : 11
Q12. Average number of girls in school – B, C & D is what percent of average number of students in school – A & D?
(a) 50%
(b) 15%
(c) 35%
(d) 20%
(e) None of the above.
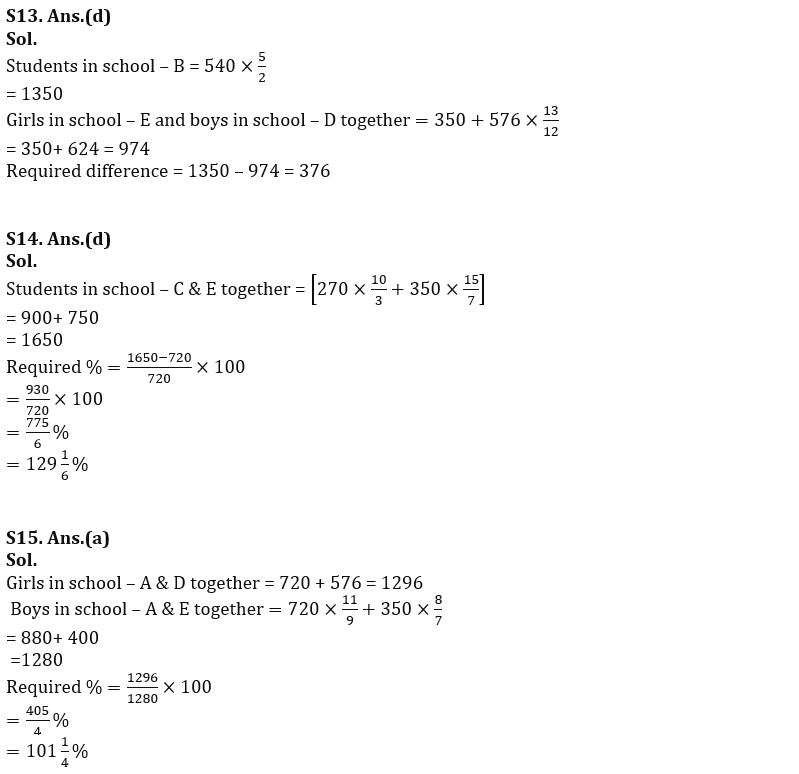
Q13. Students in school – B are how much more than girls in school – E and boys in school – D together?
(a) 388
(b) 382
(c) 394
(d) 376
(e) 374
Q14. Students in school – C & E together are what percent more or less than girls in school – A?
(a) 118⅙%
(b) 112⅔%
(c) 145½%
(d) 129⅙%
(e) 123⅔%
Q15. Girls in school – A & D together are what percent of boys in school – A & E together?
(a) 101¼%
(b) 93¾%
(c) 108½%
(d) 97¾%
(e) 99½%
Solutions


 FCI Assistant Grade 3 Previous Year Ques...
 Data Interpretation Questions for IBPS R...
 Data Interpretation Questions For Bank E...


