

Directions (1-5): The following bar graph shows the total no. of children from three different states of India who died due to poor nourishment in five different year. Study the graph carefully to answer the following questions.
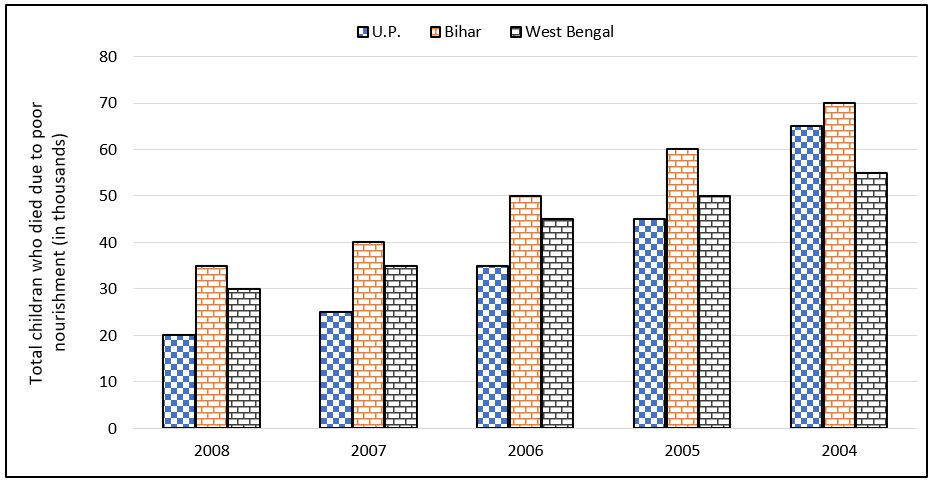
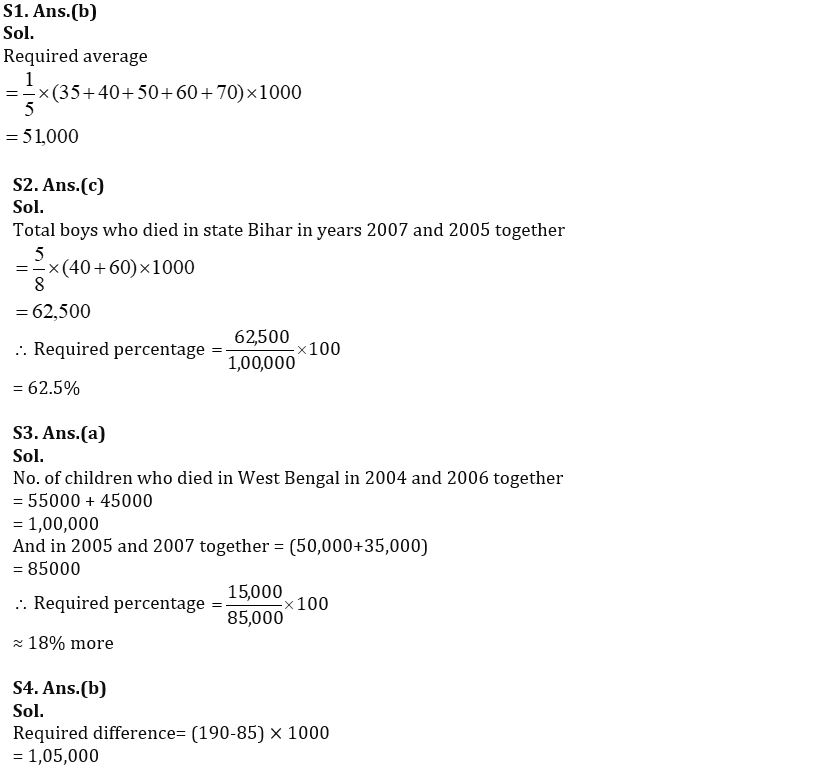
Q1. What is the average no. of children who died due to poor nourishment in Bihar over all the years together?
(a) 51,500
(b) 51,000
(c) 52,000
(d) 51,250
(e) 55,000
Q2. If the ratio of boys to girls is 5 : 3 in Bihar for each year who died due to poor nourishment then the no. of boys who died in Bihar in the year 2007 and 2005 together is approximately what percent of total no. of children who died in the same state in the same years together?
(a) 61.5%
(b) 75.75%
(c) 62.5%
(d) 60.5%
(e) 56.5%
Q3. The no. of children who died in West Bengal in the year 2004 and 2006 together is approximately what percent more or less than the no. of children who died in the year 2005 and 2007 together in same state?
(a) 18% more
(b) 18% less
(c) 12% more
(d) 12% less
(e) 27% more
Q4. What is the difference between total no. Of children who died in all the three states together in year 2004 and 2008?
(a) 1,10,000
(b) 1,05,000
(c) 1,02,500
(d) 1,01,000
(e) 1,05,500
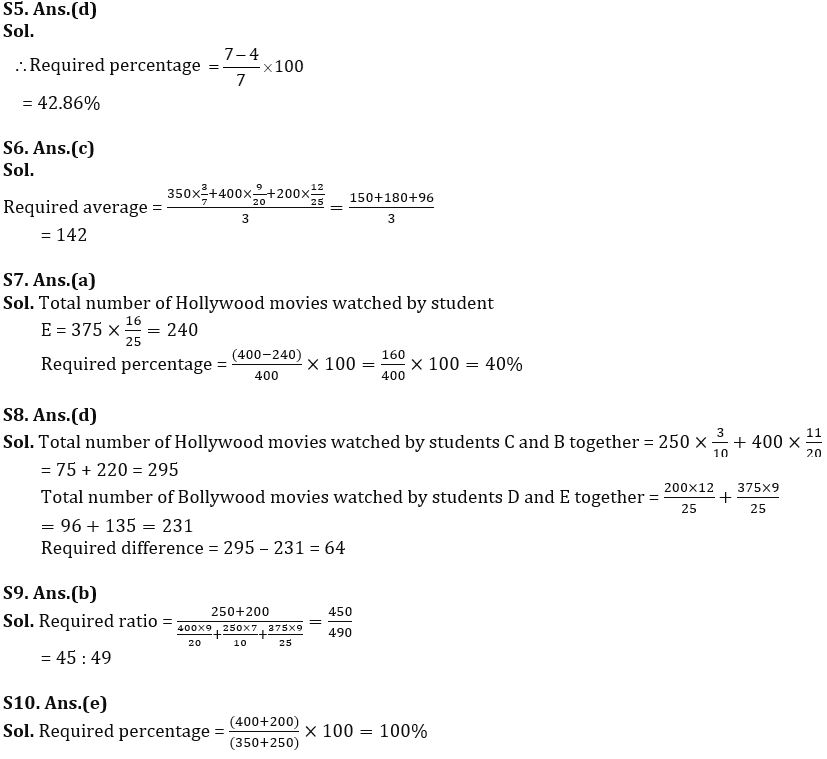
Q5. If in year 2003, the total no. of children who died was 22% more than that of the year 2004 in all the three states and ratio of boys to girls in the year 2003 were 7 : 4 then the no. of girls who died in the year 2003 was what percent more/less than the no. of boys who died in the year 2003 in all the three states together? (up to two decimal places)
(a) 40.23%
(b) 48.26%
(c) 64.28%
(d) 42.86%
(e) 52.86%
Direction (6-10): The given table shows the data related to five students and the total number of movies watched by them during a period of ten years.
Total number of movies = Number of Hollywood movies + Number of Bollywood movies.
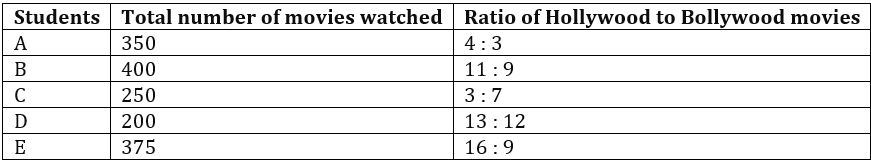
Q6. What is average number of Bollywood movies watched by students A, B and D together?
(a) 132
(b) 138
(c) 142
(d) 144
(e) 146
Q7. The total number of Hollywood movies watched by student E is what percent more/less than the total number of movies watched by student B?
(a) 40%
(b) 45%
(c) 35%
(d) 30%
(e) 50%
Q8. The total number of Hollywood movies watched by students C and B together is how much more/less than the total number of Bollywood movies watched by student D & E together?
(a) 54
(b) 74
(c) 60
(d) 64
(e) 70
Q9. Find the ratio of total number of movies watched by student C & D together to the number of Bollywood movies watched by B, C and E together?
(a) 49 : 45
(b) 45 : 49
(c) 90 : 97
(d) 10 : 11
(e) 9 : 11
Q10. The average of total number of movies watched by B and D is what percent of the average of total number of movies watched by A and C.
(a) 125%
(b) 75%
(c) 80%
(d) 120%
(e) 100%
Directions (11-15): The following line graph shows the percentage of male and female population out of total population of five different states who are drug addicts. Study the graph carefully to answer the following questions.
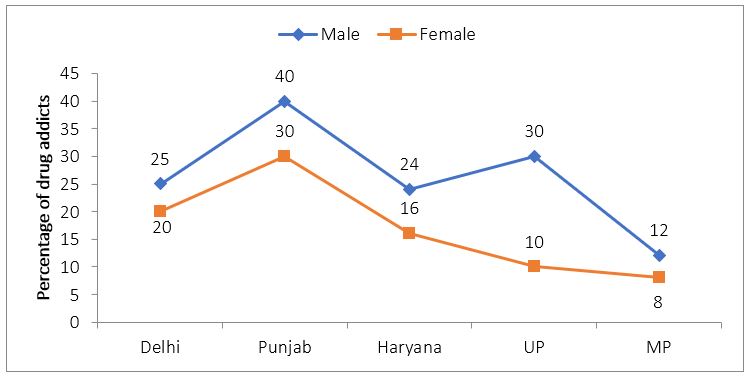
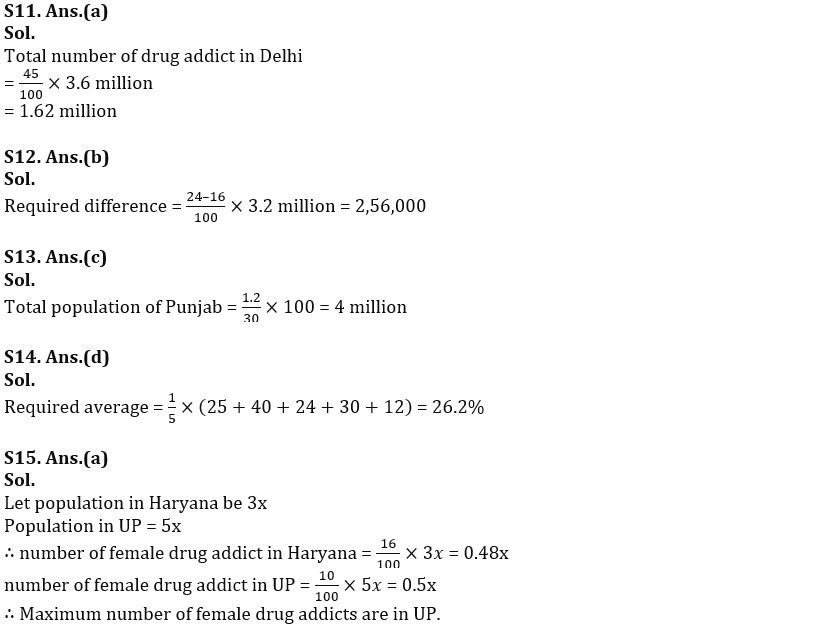
Q11. If population of Delhi is 3.6 million then find the total number of male and female together who are drug addict in Delhi.
(a) 1.62 million
(b) 1.26 million
(c) 0.62 million
(d) 2.2 million
(e) 2.6 million
Q12. If total population of Haryana is 3.2 million then total number of male drug addict in Haryana is how many more (in no.) than that of female drug addict in the same state ?
(a) 3,44,000
(b) 2,56,000
(c) 1,56,000
(d) 4,20,000
(e) None of these
Q13. If total number of female drug addict in Punjab is 1.2 million then total population of Punjab is:
(a) 4.6 million
(b) 6 million
(c) 4 million
(d) 5.4 million
(e) 3.6 million
Q14. What is average of percentage of male drug addicts in all the states together?
(a) 24.2%
(b) 28%
(c) 2.62%
(d) 26.2%
(e) 28.85
Q15. If population ratio of Haryana and UP is 3 : 5 then in which state from these two states maximum number of females are drug addict ?
(a) UP
(b) Haryana
(c) Can’t be determined
(d) Equal in both states
(e) None of these
Solutions


 Data Interpretation Questions for IBPS R...
 Data Interpretation Questions For Bank E...
 Data Interpretation Questions for SBI PO...


