

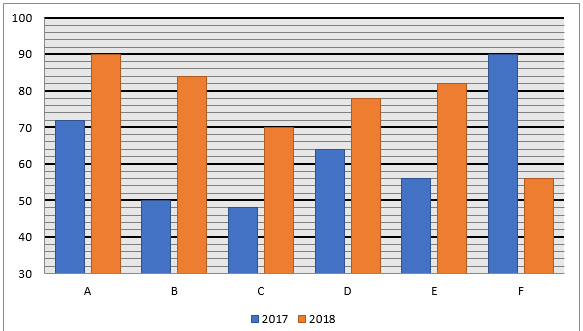
Directions (1-5): Study the bar chart given below and answer the following questions.
Bar chart shows the number of books (in ’000) sold by 6 different companies (A, B, C, D, E & F) in two different years (2017 & 2018).
Quantitative Aptitude Quiz For IDBI 2022- 2nd June CHECK IN HINDI
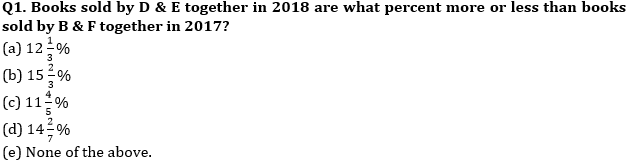
Q2. Find the ratio of books sold by A & C together in 2017 to books sold by E & F together in 2018.
(a) 20 : 23
(b) 15 : 16
(c) 3 : 8
(d) 10 : 17
(e) 4 : 5
Q3. Average number of books sold by A, B & D in 2017 are how much more or less than average number of books sold by C & E in 2018?
(a) 19000
(b) 14000
(c) 12000
(d) 20000
(e) 16000
Q4. Books sold by A, C & F together in 2017 are what percent of books sold by A, D & E together in 2018?
(a) 96%
(b) 88%
(c) 80%
(d) 95%
(e) 84%
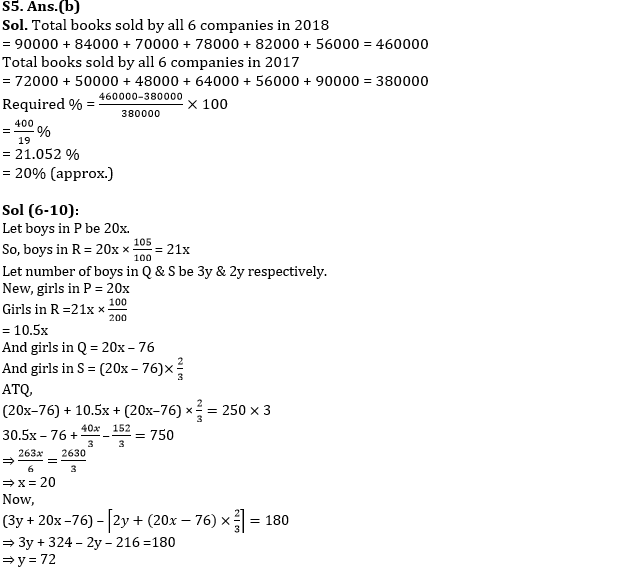
Q5. Total books sold by all 6 companies in 2018 are what percent more or less than total books sold by all 6 companies in 2017?
(a) 40%
(b) 20%
(c) 50%
(d) 10%
(e) 30%
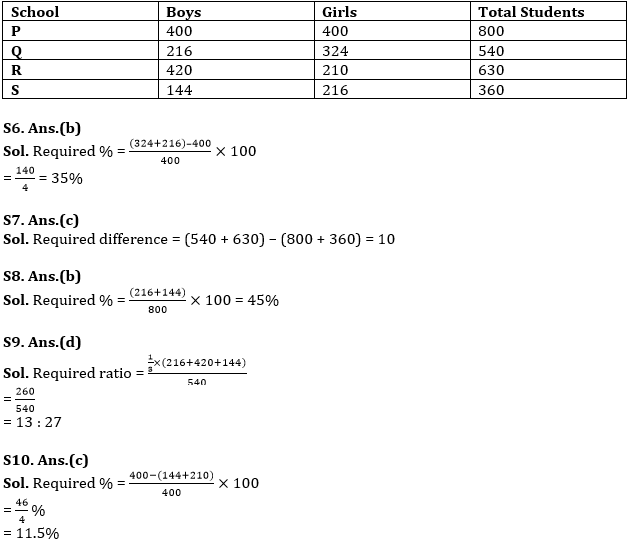
Directions (6-10): Study the passage given below and answer the following questions.
There are 4 schools – P, Q, R & S. Boys in R are 5% more than boys in P and ratio of boys in Q to that of in S is 3 : 2. In P, boys and girls are equal and in R, boys are 100% more than girls. Girls in Q are 76 less than girls in P. Ratio of girls in Q to that of in S is 3 : 2. Average number of girls in Q, R & S is 250. Total students in Q are 180 more than total students in S.
Q6. Girls in Q & S together are what percent more or less than boys in P?
(a) 55%
(b) 35%
(c) 45%
(d) 40%
(e) 50%
Q7. Total students in P & S together are how much more or less than total students in Q & R together?
(a) 70
(b) 90
(c) 10
(d) 120
(e) 40
Q8. Boys in Q & S together are what percent of total students in P?
(a) 30%
(b) 45%
(c) 50%
(d) 65%
(e) 40%
Q9. Find ratio of average number of boys in Q, R & S to total students in Q.
(a) 4 : 7
(b) 1 : 6
(c) 11 : 16
(d) 13 : 27
(e) None of the above.
Q10. Boys in S & girls in R together are what percent less than girls in P?
(a) 10.5%
(b) 12.5%
(c) 11.5%
(d) 8.5%
(e) 13.5%
Directions (11-15): The given bar show shows the no. of Laptops sold by five companies (A, B, C, D and E) in two different years.
Study the given graph carefully and answer the following questions.
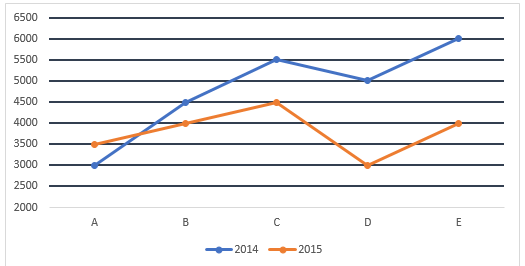
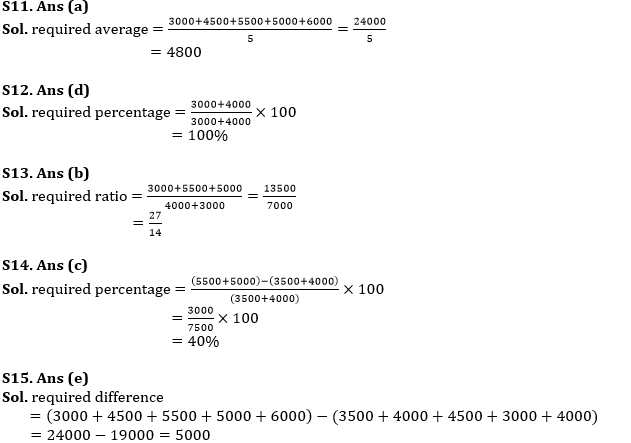
Q11. Find the average number of laptops sold in year 2014 by all the five companies?
(a) 4800
(b) 5200
(c) 5500
(d) 5600
(e) 5800
(f) 4500
Q12. Laptops sold by company A in 2014 and B in 2015 together in what percent of laptops sold by company D and E together in 2015?
(a) 0%
(b) 50%
(c) 75%
(d) 100%
(e) 125%
Q13. What is the ratio between the laptops sold by company A, C and D in 2014 to that of company B and D in 2015?
(a) 23/14
(b) 27/14
(c) 2/1
(d) 29/14
(e) 14/27
Q14. Laptops sold by C and D together in 2014 is what percentage more than laptops sold by A and B in 2015?
(a) 44 ⅓%
(b) 41 ⅔%
(c) 40%
(d) 47 ⅓%
(e) 46 ⅓%
Q15. Total laptops sold in year 2014 is how much more/less than total laptops sold in year 2015?
(a) 2000
(b) 4000
(c) 6000
(d) 3000
(e) 5000
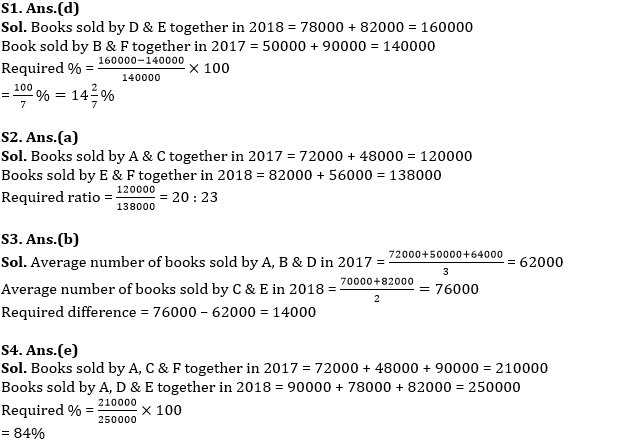
Solutions


 Data Interpretation Questions for IBPS R...
 Data Interpretation Questions For Bank E...
 Data Interpretation Questions for SBI PO...


