

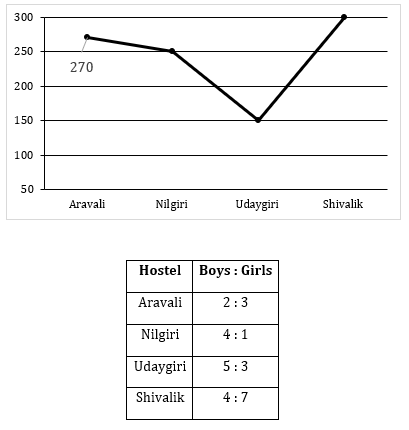
Directions (1-5): Pie-chart given bellows shows the income of five different persons and bar graph shows the percentage distribution of their income on different things. Study the question carefully and answer them.
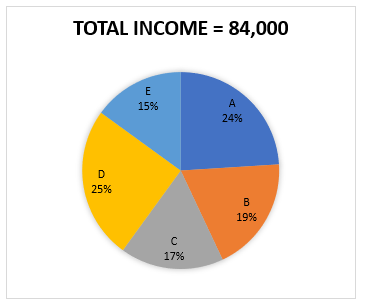
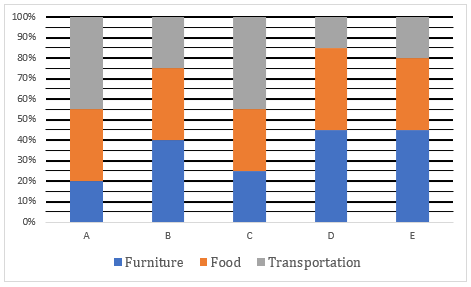
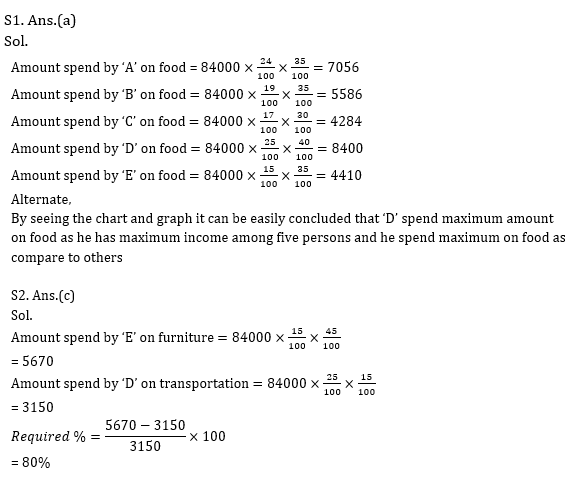
Q1. Who among the following spend maximum amount on food?
(a) D
(b) E
(c) B
(d) C
(e) A
Q2. Amount spend by ‘E’ on furniture is what percent more than amount spend by ‘D’ on Transportation?
(a) 70%
(b) 45%
(c) 80%
(d) 65%
(e) 60%
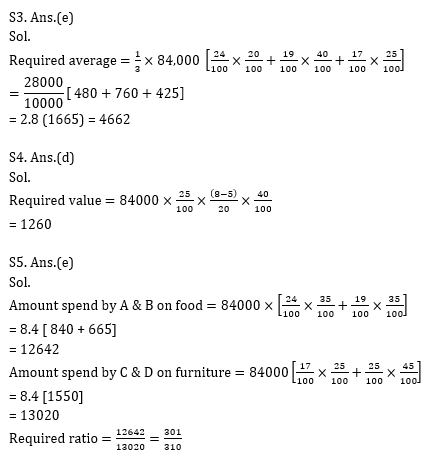
Q3. Find the average amount spend by A, B and C on furniture?
(a) 4622
(b) 4626
(c) 4262
(d) 4266
(e) 4662’
Q4. ‘D’ buy only three type of food X, Y and Z and amount spend on buying X, Y and Z is in the ratio 5 : 7 : 8. What is the difference between amount spend on buying Z type food to amount spend on buying X type food.
(a) 2520
(b) 1680
(c) 8400
(d) 1260
(e) 2100
Q5. Find the ratio of amount spend by ‘A’ and ‘B’ together on food to the amount spend by ‘C’ and ‘D’ together on furniture?
(a) 295 : 277
(b) 277 : 295
(c) 310 : 301
(d) 301 : 305
(e) 301 : 310
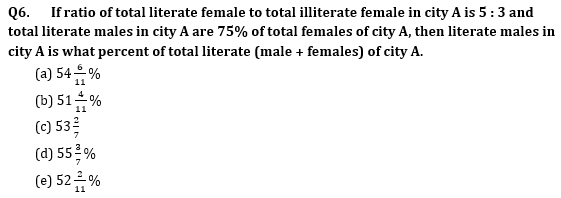
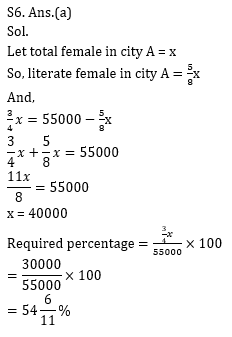
Directions (6-10): Given below is the pie chart which shows the percentage distribution of females in five cities and table shows the total number of literates (male + female) in these five cities.
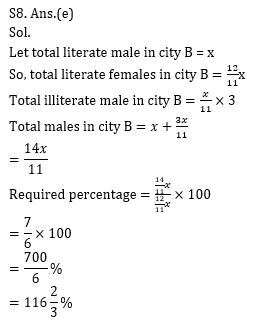
Total population of any city = Male + Female
Total males = Literate + Illiterate
Total female = Literate + Illiterate
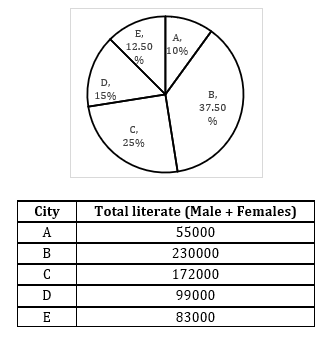
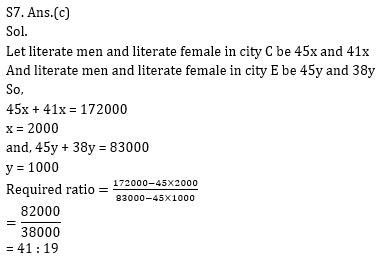
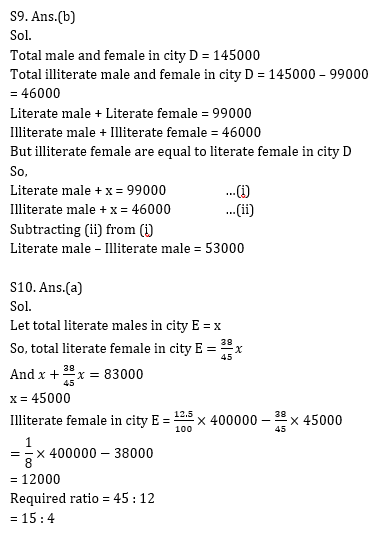
Q7. If ratio of literate male to literate female in city C and E are 45 : 41 and 45 : 38 respectively then what is the ratio of literate female of city C to literate female of city E.
(a) 53 : 17
(b) 43 : 17
(c) 41 : 19
(d) 40 : 19
(e) 50 : 21
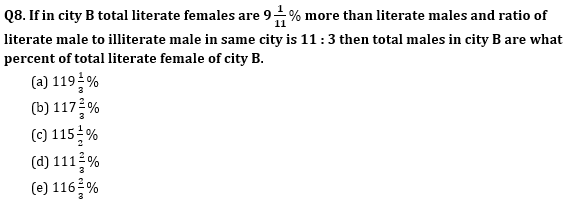
Q9. Total male and female in city D is 145000 if total illiterate female in city D are equal to total literate female in city D then find the difference in number of literate males and illiterate male in city D
(a) 55000
(b) 53000
(c) 57000
(d) 60000
(e) 50000
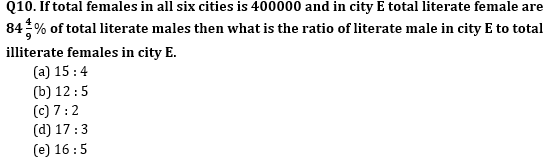
Directions (11-15): A school has four hostels in which there are two sections one for boys and one for girls. Line chart given below shows increase/decrease in total number of students in 2013 in these hostels as compare to 2012(previous year). Table given below shows ratio between number of boys to number of girls in these hostels in 2013. Study the data carefully and answer the following questions
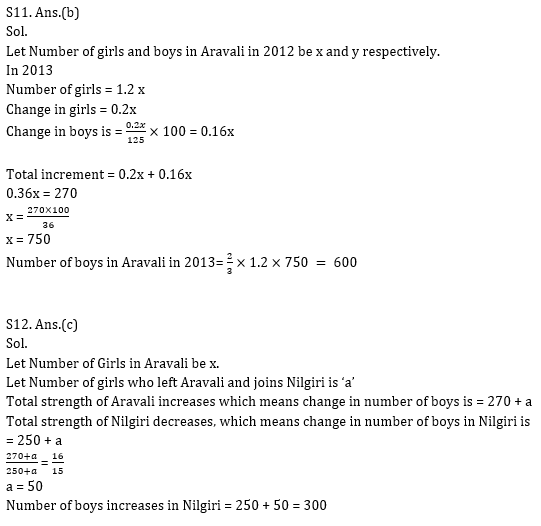
Q11. In Aravali, number of girls in 2013 is 20% more than that in 2012. If change in the number of girls in Aravali is 25% greater than change in number of boys in Aravali then find the Number of boys in Aravali in 2013.
(a) 900
(b) 600
(c) 500
(d) 750
(e) 800
Q12. Number of students is increases and decreases in Aravali and Nilgiri in 2013 respectively as compare to 2012. Number of girls who left Aravali joins Nilgiri (No other change in Number of girls) such that ratio between increase and decreases in Number of boys in Aravali and Nilgiri in 2013 as compare to 2012 is 16 : 15, then find the change in Number of boys in Nilgiri?
(a) 350
(b) 320
(c) 300
(d) 420
(e) 400
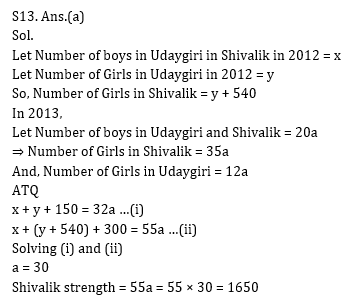
Q13. In 2012, Number of boys in Udaygiri and Shivalik are equal and Number of girls in Shivalik is 540 more than the Number of girls in Udaygiri. If in 2013, Number of boys in both hostels are equal then find the Number of total students in Shivalik, If In 2013 strength of both hostels increases as compare to previous year
(a) 1650
(b) 1200
(c) 960
(d) 1500
(e) 900
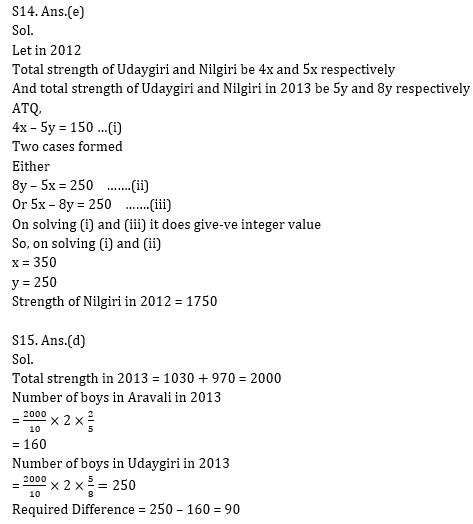
Q14. In 2012 and in 2013 ratio of total strength of Udaygiri to that of Nilgiri is 4 : 5 and 5 : 8 respectively. Find the strength of Nilgiri in 2012 if strength of Udaygiri decreases
(a) 1600
(b) 1200
(c) 1250
(d) 1400
(e) 1750
Q15. In2013, strength of all hostels increases as compare to 2012. If total strength of hostels in 2012 is 1030, then find the Number of boys in Aravali in 2013 is how much more than the Number of boys in Udaygiri in 2013, given that ratio of strength of Aravali, Nilgiri, Udaygiri and Shivalik is 2 : 3 : 2 : 3 respectively
(a) 80
(b) 100
(c) 120
(d) 90
(e) 10
Practice More Questions of Quantitative Aptitude for Competitive Exams:
Solutions
Practice with Crash Course and Online Test Series for IBPS PO/RBI Assistant 2020:
- RBI Assistant Mains 2020 Online Test Series
- IBPS PO Online test series (Prelims + Mains) 2020 by Adda247
- IBPS KA MAHAPACK Online Live Classes


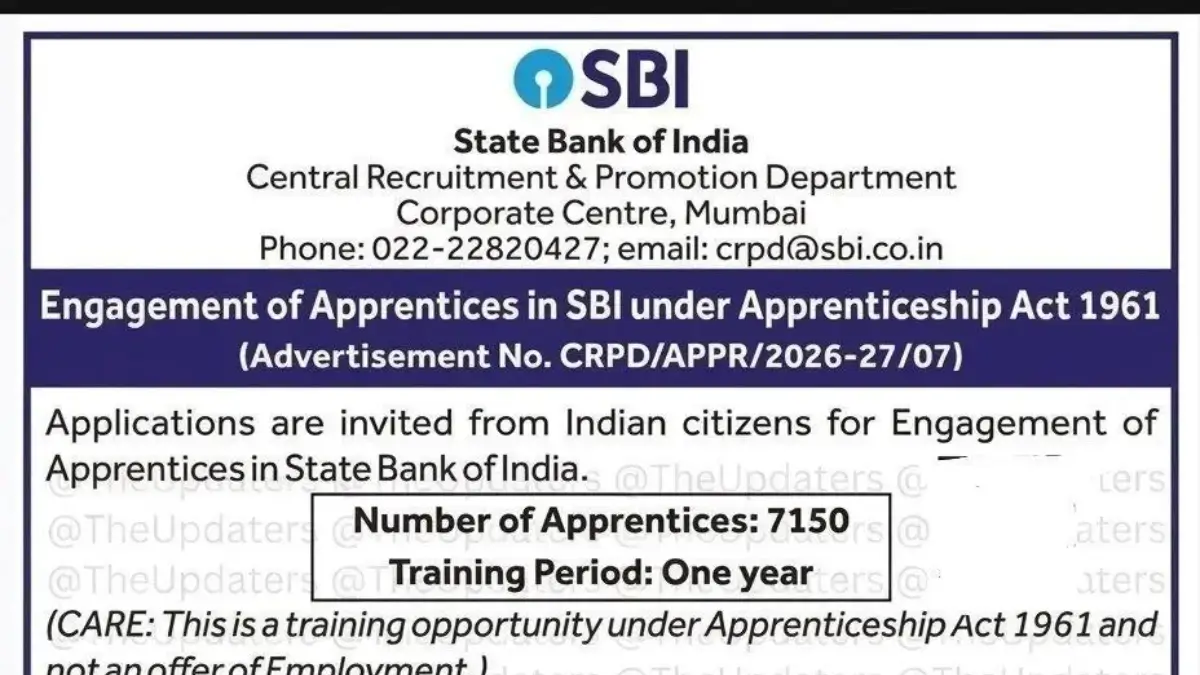 SBI Apprentice Recruitment 2026 Notifica...
 SBI Apprentice Salary 2026, Salary Struc...
 Bank of Baroda Apprentice Syllabus and E...


