

Directions (1-5): What value should come in place of (?) in the following questions?
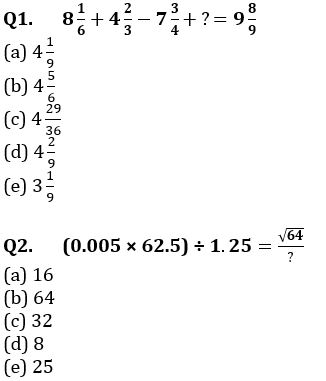
Q3. [(31)² + (11)²] × (0.5)² = 19²- ?
(a) 100.5
(b) 90.5
(c) 80.5
(d) 60.5
(e) 95.5
Q4. 12% of 550 + 18% of 600 – ⅚×174 = ?
(a) 32
(b) 27
(c) 37
(d) 29
(e) 31
Q5. (20% of 30% of 60% of 750) + ? =√841
(a) 5
(b) 4
(c) 3
(d) 7
(e) 2
Directions (6-10): Read the paragraph carefully and answer the questions
Mr. DK started telecommunications and he need to purchase some item for this. He purchased X no of chairs, Y no. of tables. He also purchased mobiles and laptops. No. of mobiles are 9 less than no. of chairs and total cost of purchasing chairs are Rs. 200 less than that of tables. M.R.P. of chair and table is same; Mr. DK purchased these two items at 16⅔% and 33⅓% discount respectively. Total cost of purchasing laptop and mobiles are Rs. 65000 and no. of laptop are 4 more than no. mobiles and 3.5% of purchasing cost of a table. Cost of a laptop is 8000 which is 33⅓% more than twice of cost of a mobile.
Q6. If Mr. DK had purchased mobile and laptop at 40% and 11.11% discounts respectively, then find difference between their M.R.P.?
(a) Rs. 5000
(b) RS. 8000
(c) Rs.2000
(d) Rs. 4000
(e) Rs. 9000
Q7. Find total amount spent on purchasing 10 chairs and 8 table?
(a) Rs. 4100
(b) Rs. 4000
(c) Rs. 6100
(d) Rs. 3100
(e) Rs. 6500
Q8. No. of laptops are how much percent more than no. of mobiles purchased?
(a) 137.5%
(b) 133.33%
(c) 114.28%
(d) 112.5%
(e) None of these.
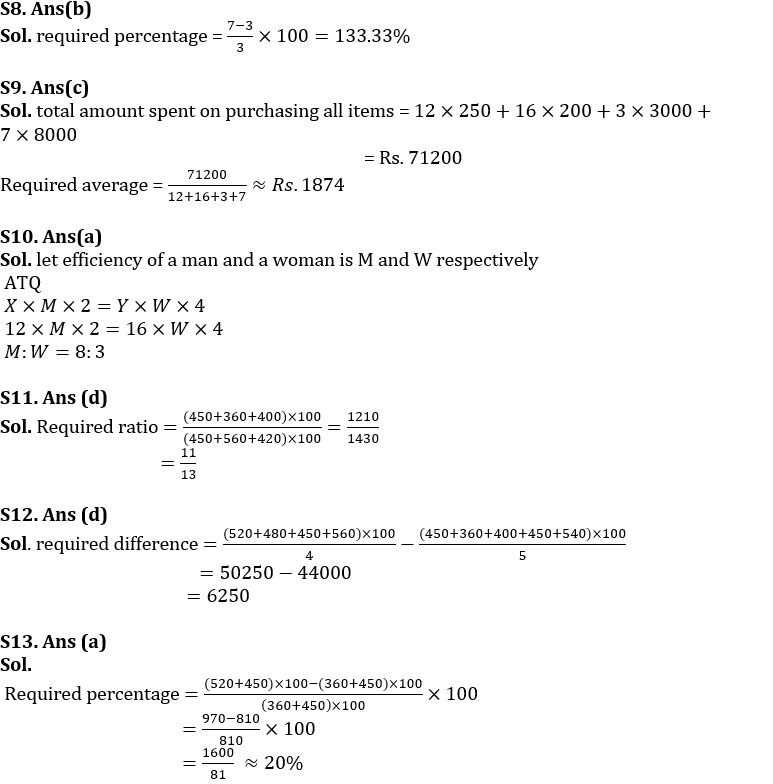
Q9. Find average money spent by Mr. DK on purchasing of all items? (approx.)
(a) Rs.1800
(b) Rs. 1754
(c) Rs. 1874
(d) Rs. 1990
(e) Rs. 2109
Q10. If X men can do a work in 2 days and Y women can do the same work in 4 days find ratio of efficiency of men to women?
(a) 8:3
(b) 3:4
(c) 1:2
(d) 2:1
(e) 4:3
Directions (11-15): The following line graph shows the production of cars (in ’00) of two companies Ford and Honda from year 2013 to 2017.
Read the graph carefully and answer the following questions.
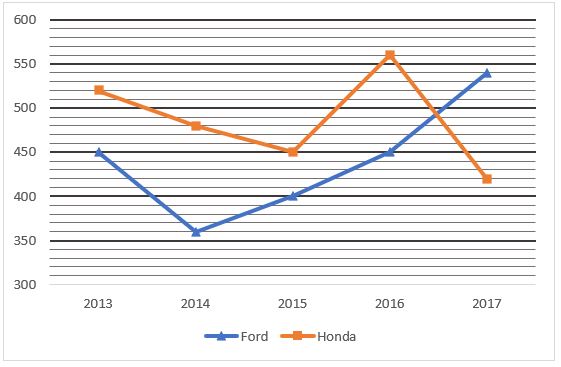
Q11. Find the ratio between the total production of Ford cars during 2013-2015 to that of Honda during 2015-2017.
(a) 13/11
(b) 10/13
(c) 9/11
(d) 11/13
(e) 11/14
Q12. Find the difference between average of production of Ford cars in all over the years and average of production of Honda cars from year 2013-2016.
(a) 3215
(b) 6520
(c) 3125
(d) 6250
(e) 5260
Q13. The total production of Honda cars in 2013 and 2015 together is how much percent (approximate) more/less than the total production of Ford cars in 2014 and 2016 together?
(a) 20%
(b) 30%
(c) 23%
(d) 28%
(e) 18%
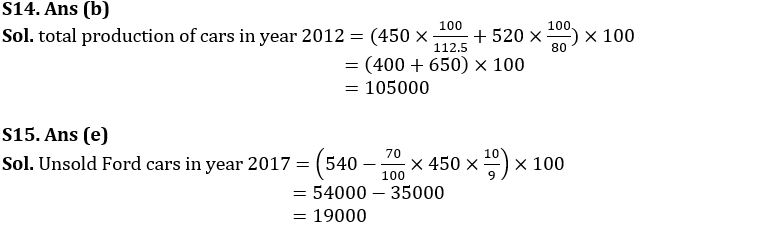
Q14. If in year 2013, the production of Ford cars is 12.5% more than previous year and production of Honda cars is 20% less than previous year. What is the total production of cars in year 2012?
(a) 115000
(b) 105000
(c) 95000
(d) 102000
(e) 120000
Q15. The ratio of sold cars of Honda in year 2015 to that of Ford cars in year 2017 is 9∶10. If only 70% of Honda cars in year 2015 are sold, then how many Ford cars in year 2017 are unsold?
(a) 17000
(b) 35000
(c) 31500
(d) 21500
(e) 19000
Solutions


 Quantitative Aptitude Quiz For Bank Main...
 Quantitative Aptitude Quiz For Bank Foun...


