

Directions (1-5): Read the below mentioned pie chart carefully to answer the following questions.
Pie chart shows the percentage distribution of people who watches different web series. Consider that people watch no other web series apart from those which are mentioned in the pie chart.
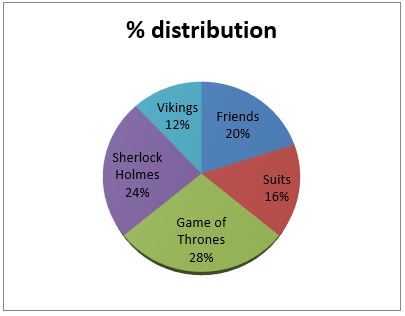
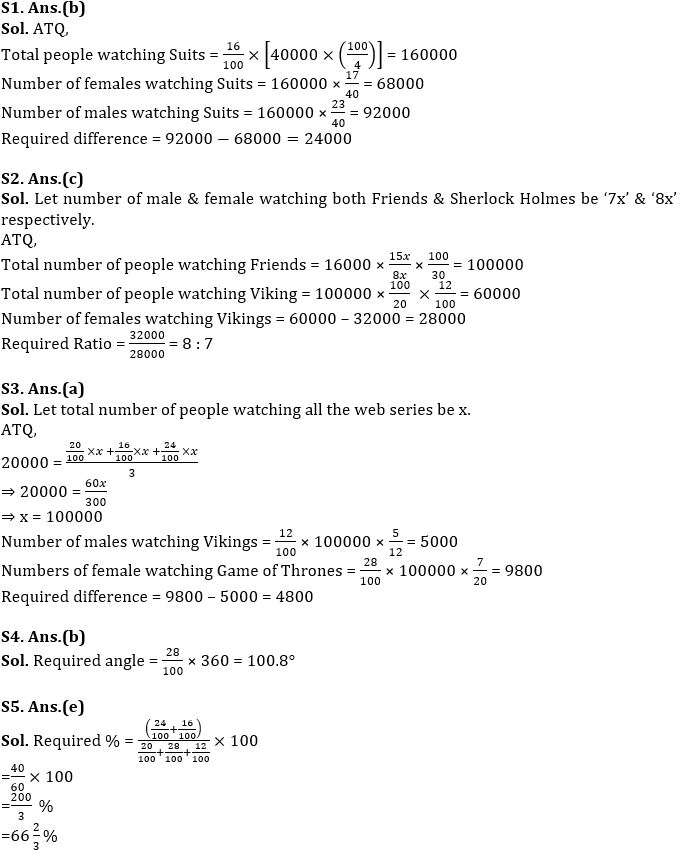
Q1. The ratio of male to female watching Suits is 23 : 17 and people watching Friends is 40000 less than the people watching Sherlock Holmes. Find difference between total male watching Suits and total female watching Suits?
(a) 16000
(b) 24000
(c) 28000
(d) 30000
(e) 36000
Q2. 30% people who watch Friends also watch Sherlock Holmes and number of females watching both Friends & Sherlock Holmes is 16000. Then find ratio of male to female watching Vikings, if number of males watching Vikings is 32000. (Ratio of male to female watching both Friends & Sherlock Holmes is 7:8)?
(a) 12 : 11
(b) 4 : 3
(c) 8 : 7
(d) 1 : 2
(e) 9 : 7
Q3. Average of people watching Friends, Suits and Sherlock Holmes is 20000. Ratio of male to female watching Game of Thrones and Vikings is 13 : 7 and 5 : 7 respectively. Find the difference between number of males watching Vikings and number of females watching Game of thrones.
(a) 4800
(b) 9800
(c) 5000
(d) 11200
(e) 13200
Q4. Find the central angle (in degrees) of people watching Game of Thrones web series.
(a) 121.2
(b) 100.8
(c) 112.9
(d) 105.5
(e) 116.2
Q5. People watching Sherlock Holmes & Suits together is what percent of people watching Friends, Game of Thrones and Vikings together?
(a) 50%
(b) 100%
(c) 63 ⅔%
(d) 60 ⅔%
(e) 66 ⅔%
Directions (6-10): Study the following line graph which shows the number of students who joined and left the college in the beginning of year for six consecutive years from 2010 to 2015.
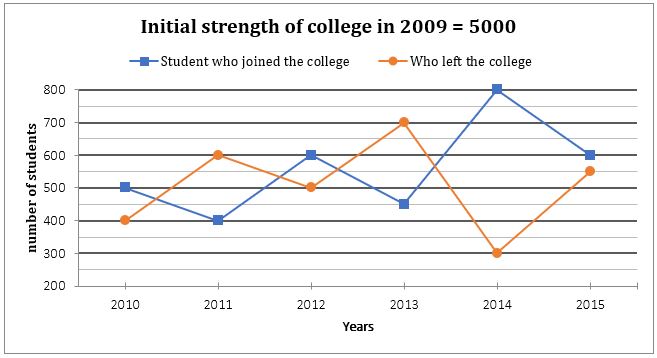
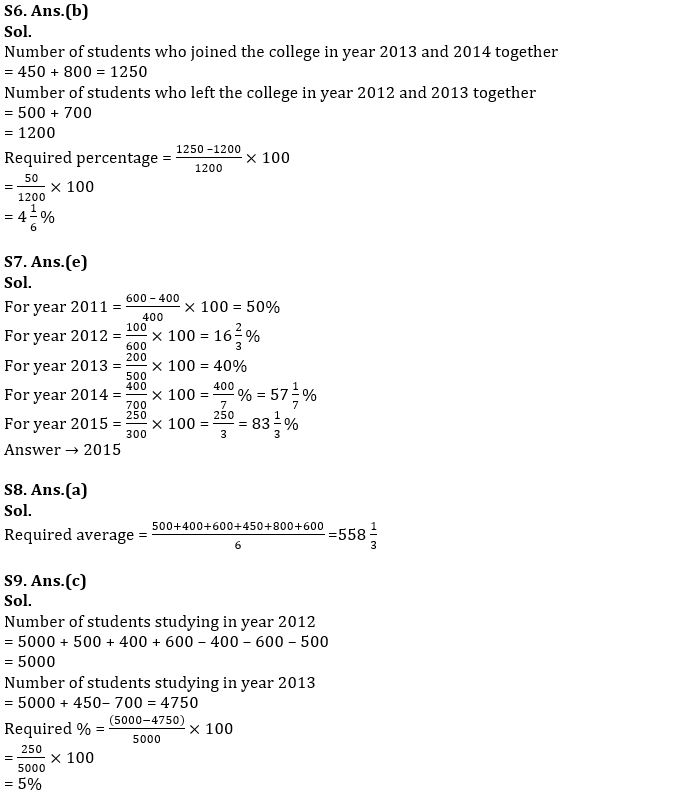
Q6. The number of students who joined the college in year 2013 and 2014 together is what percent more or less than the total number of students who left the college in year 2012 and 2013 together.
(a) 5⅙%
(b) 4⅙%
(c) 5 ½ %
(d) 5%
(e) 4%
Q7. For which year, the percentage rise/fall in the number of students who left the college compared to the previous year is maximum?
(a) 2011
(b) 2012
(c) 2013
(d) 2014
(e) 2015
Q8. Find the average of all the students who joined the college in all the given six years.
(a) 558⅓
(b)580
(c) 578⅔
(d) 578⅙
(e) 558⅙
Q9. Find the percentage increase/decrease in the number of students studying in college from year 2012 to 2013.
(a) 4%
(b) 4 ½ %
(c) 5%
(d) 5 ½ %
(e) 6%
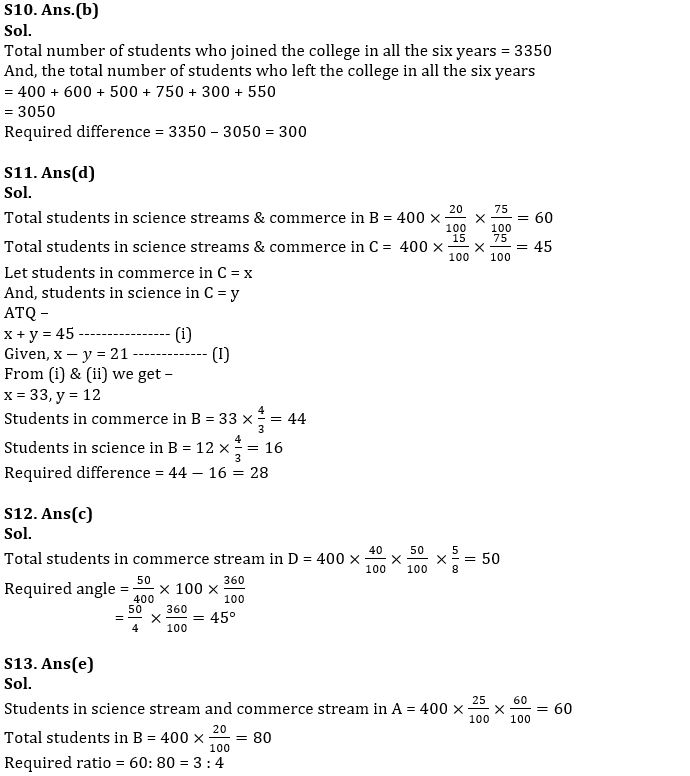
Q10.Find the difference between the total number of students who have joined the college for six years and the number of students who left the college during all the six years ?
(a) 250
(b) 300
(c) 200
(d) 270
(e) 280
Directions (11-15): Pie chart given below shows percentage distribution on number of students in three streams (Art, Science & commerce) in four colleges. Read the data carefully and answer the questions.
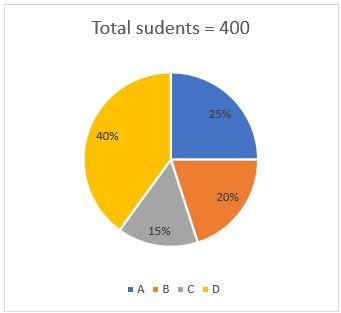
Q11. 25% students from each college B & C are in art streams and students in science streams & commerce in C are 25% less than students in science streams & commerce in B respectively. If students in science streams are 21 less than students in commerce in stream C, then find difference between students in commerce & science stream in B?
(a) 8
(b) 18
(c) 22
(d) 28
(e) 24
Q12. If 50% students in D are in art stream and ratio of students in science stream to commerce stream is 3 : 5, then find central angle for students in commerce stream in D with respect of total students in all four colleges?
(a) 108°
(b) 30°
(c) 45°
(d) 72°
(e) 54°
Q13. If 40% students in A are in art stream, then find ratio of students in science stream and commerce stream in A to total students from B?
(a) 5 : 4
(b) 3 : 7
(c) 3 : 2
(d) 3 : 5
(e) 3 : 4
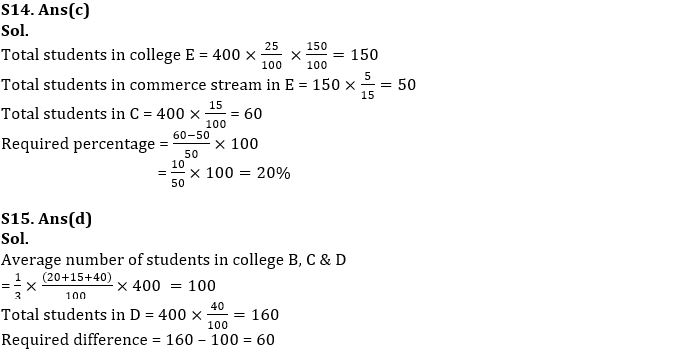
Q14. If total students in college E are 50% more than that of in college A and ratio of students in art, science and commerce stream in E is 7 : 3 : 5, then find total students in college C is what percent more than total students in commerce stream in E?
(a) 12.5%
(b) 10%
(c) 20%
(d) 25%
(e) 15%
Q15. Find difference between average number of students in college B, C & D & total students in D?
(a) 105
(b) 75
(c) 45
(d) 60
(e) 40
Solutions


 Quantitative Aptitude Quiz For Bank Main...
 Quantitative Aptitude Quiz For Bank Foun...


