

Directions (1-5): The given bar graph shows the number of phones (Samsung, Micromax and MI) sold by Store ‘A’ in different 5 different years. Study the graph and answer the following questions.
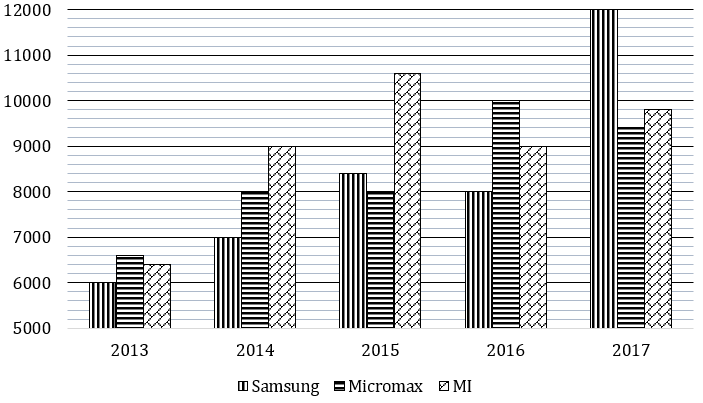
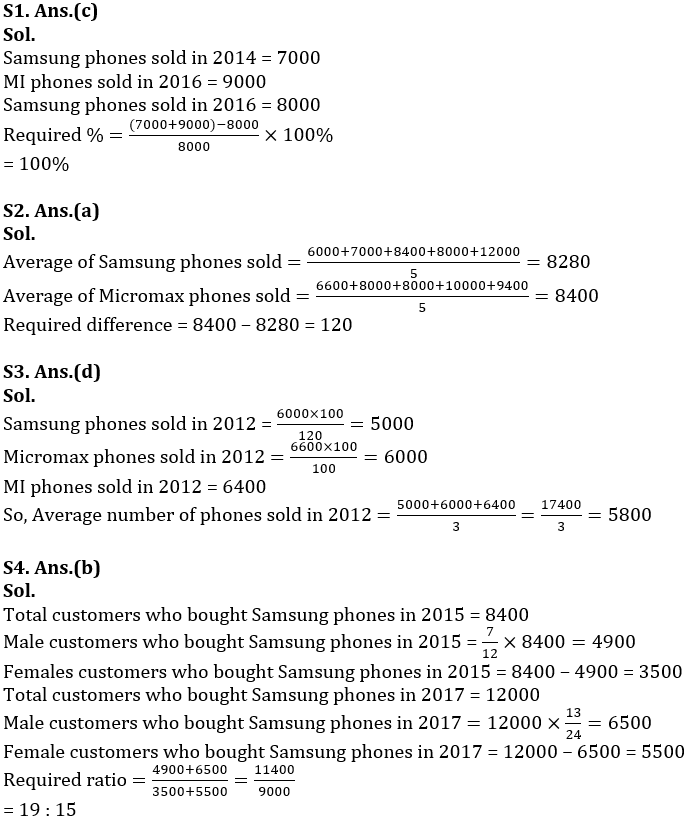
Q1. Samsung phones sold in 2014 and MI phones sold in 2016 together is what percent more/loss then Samsung phones sold in 2016.
(a) 137.5%
(b) 75%
(c) 100%
(d) 84%
(e) 80%
Q2. Find the difference between average number of Samsung phones sold to average number of Micromax mobile sold in given five years by store A?
(a) 120
(b) 82
(c) 98
(d) 136
(e) 125
Q3. If Samsung, Micromax and MI phones sold in 2013 is 20%, 10% and 0% respectively more than these mobiles sold in 2012 respectively, then, find average number of phones sold in 2012 of all three companies by store A
(a) 4000
(b) 6275
(c) 5600
(d) 5800
(e) 5000
Q4. In 2015, Samsung phones sold to male customers and female customers is in the ratio 7 : 5. In 2017, Samsung phones sold to male customers and female customers in the ratio 13 : 11. Find the ratio of male customers to female customers who bought Samsung in 2015 and 2017 together.
(a) 17 : 13
(b) 19 : 15
(c) 31 : 19
(d) 11 : 15
(e) 11 : 17
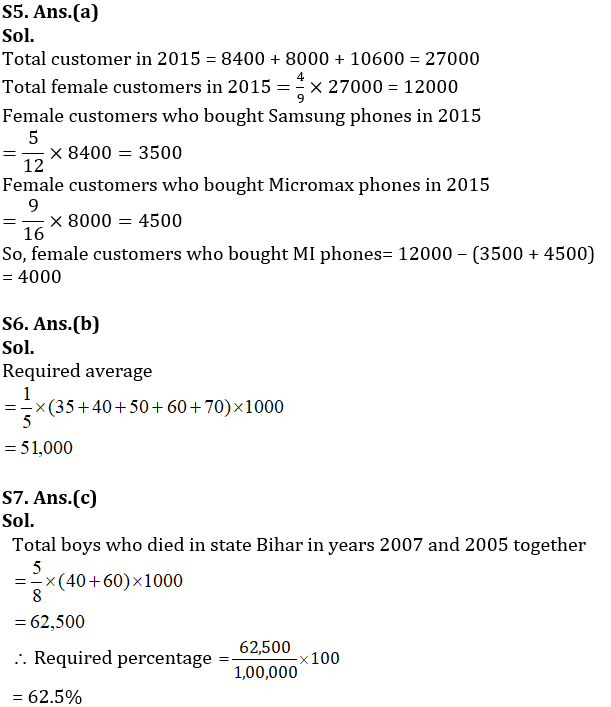
Q5. If in 2015, ![]() customer of store ‘A’ are female and male customer to female customer ratio of Samsung and Micromax in 2015 is 7 : 5 and 7 : 9 respectively then, find the female customers who bought MI phones in 2015.
customer of store ‘A’ are female and male customer to female customer ratio of Samsung and Micromax in 2015 is 7 : 5 and 7 : 9 respectively then, find the female customers who bought MI phones in 2015.
(a) 4000
(b) 3500
(c) 6000
(d) 5400
(e) 4800
Directions (6-10): The following bar graph shows the total no. of children from three different states of India who died due to poor nourishment in five different year. Study the graph carefully to answer the following questions.
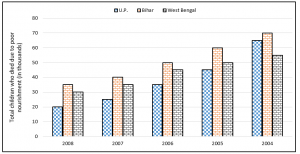
Q6. What is the average no. of children who died due to poor nourishment in Bihar over all the years together?
(a) 51,500
(b) 51,000
(c) 52,000
(d) 51,250
(e) 55,000
Q7. If the ratio of boys to girls is 5 : 3 in Bihar for each year who died due to poor nourishment then the no. of boys who died in Bihar in the year 2007 and 2005 together is approximately what percent of total no. of children who died in the same state in the same years together?
(a) 61.5%
(b) 75.75%
(c) 62.5%
(d) 60.5%
(e) 56.5%
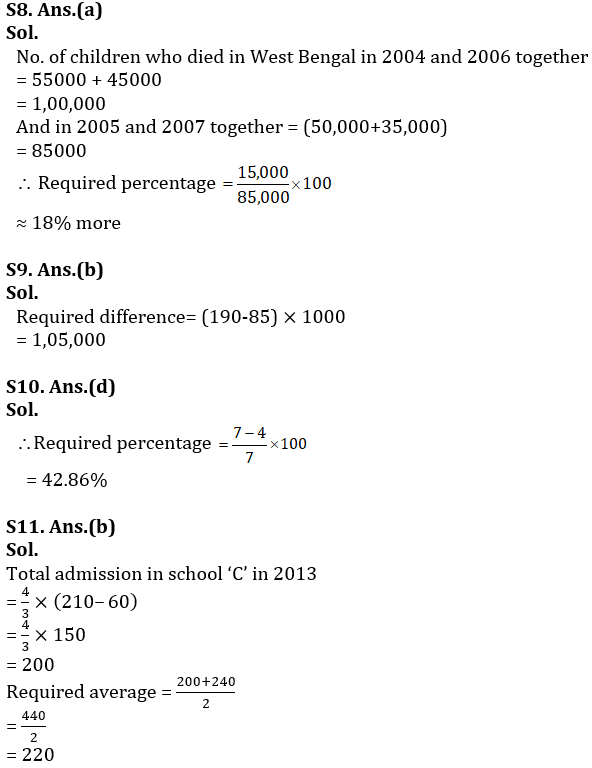
Q8. The no. of children who died in West Bengal in the year 2004 and 2006 together is approximately what percent more or less than the no. of children who died in the year 2005 and 2007 together in same state?
(a) 18% more
(b) 18% less
(c) 12% more
(d) 12% less
(e) 27% more
Q9. What is the difference between total no. Of children who died in all the three states together in year 2004 and 2008?
(a) 1,10,000
(b) 1,05,000
(c) 1,02,500
(d) 1,01,000
(e) 1,05,500
Q10. If in year 2003, the total no. of children who died was 22% more than that of the year 2004 in all the three states and ratio of boys to girls in the year 2003 were 7 : 4 then the no. of girls who died in the year 2003 was what percent more/less than the no. of boys who died in the year 2003 in all the three states together? (up to two decimal places)
(a) 40.23%
(b) 48.26%
(c) 64.28%
(d) 42.86%
(e) 52.86%
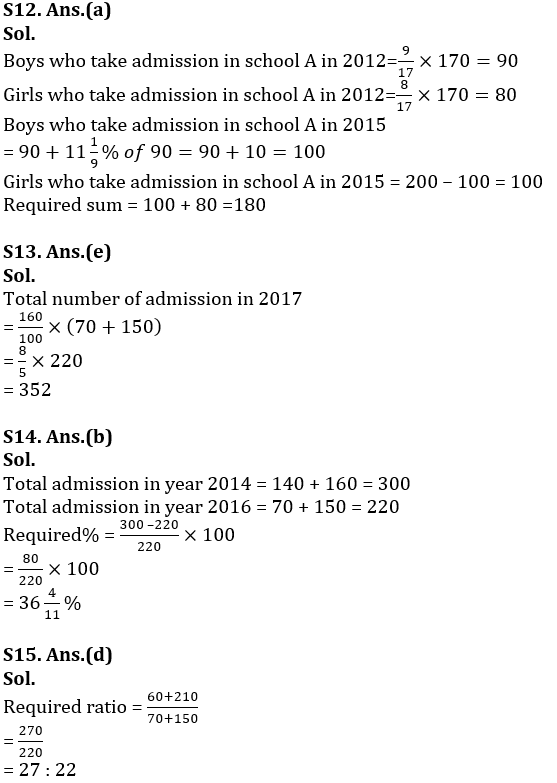
Directions (11-15): Bar chart given below shows the total number of admissions took place in two different schools A and B from year 2012 to year 2016. Based on this bar chart, solve the following questions.
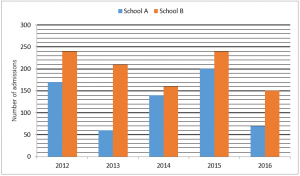
Q11. If in another school C, total student who took admission in year 2013 is 33⅓% more than the difference of admissions took place in school A and B in same year then, find the average of admission in school C in year 2013 and school B in year 2015 together.
(a) 225
(b) 220
(c) 210
(d) 205
(e) 200
Q13. If in year 2017 there is 60% increase in the total number of admissions in both schools from previous year, then find the total number of admission in 2017.
(a) 312
(b) 322
(c) 332
(d) 342
(e) 352
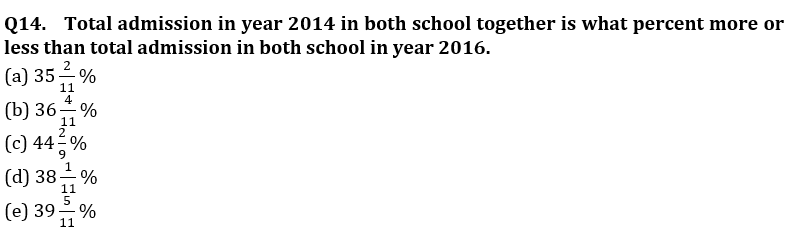
Q15. Find the ratio of total admission in both school in year 2013 to total admission in both school in year 2016.
(a) 29 : 22
(b) 13 : 11
(c) 14 : 11
(d) 27 : 22
(e) 25 : 22
Practice More Questions of Quantitative Aptitude for Competitive Exams:
Solutions
![]()


 General Awareness Quiz for Bank Mains Ex...
 English Language Quiz For Bank Foundatio...
 Reasoning Quiz For Bank Foundation 2024 ...


