
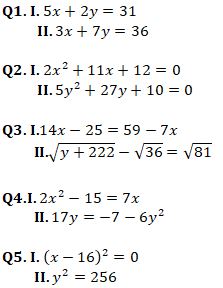
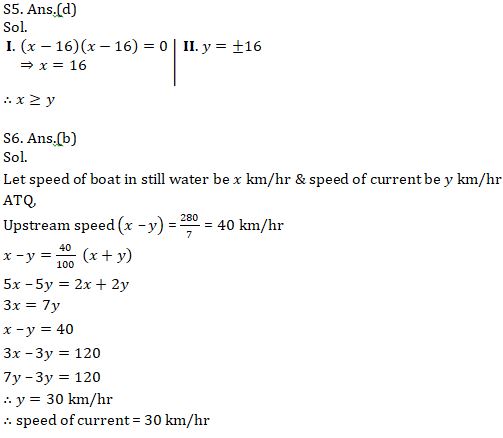
Directions (1-5): Two equations I and II are given below in each question. You have to solve these equations and give answer if
(a) if x<y
(b) if x> y
(c) if x≤ y
(d) if x≥ y
(e) if x= y or no relation can be established
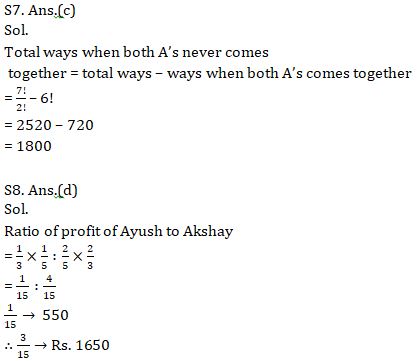
Q6. Speed of boat to cover a distance in upstream is 40% of the boat to cover same distance in downstream. Find the speed of current if time taken to cover 280 km in upstream is 7 hours. (in km/hr)
(a) 25
(b) 30
(c) 20
(d) 35
(e) 40
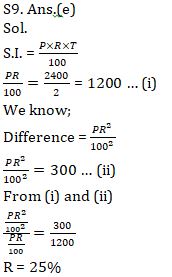
Q7. In how many different ways the letter of words ‘MUBARAK’ be arranged so that both A’s never comes together?
(a) 1600
(b) 1760
(c) 1800
(d) 1540
(e) 1840
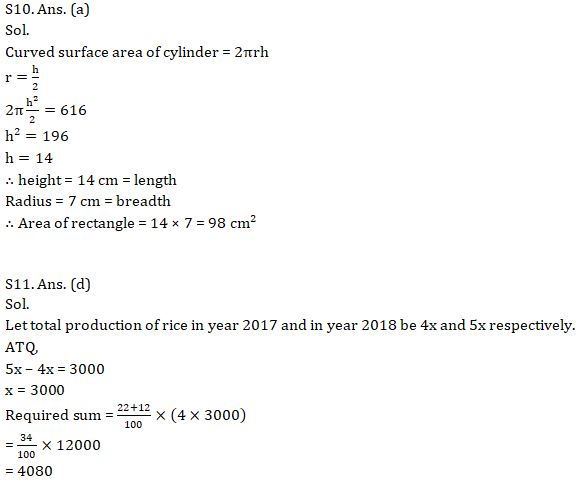
Q9. Simple interest for a period of two years is Rs. 2400. If difference of CI and SI for same period is Rs. 300. Then find the rate of interest. [Amount given in each case is same & rate is also same].
(a) 12.5%
(b) 305
(c) 35%
(d) 20%
(e) 25%
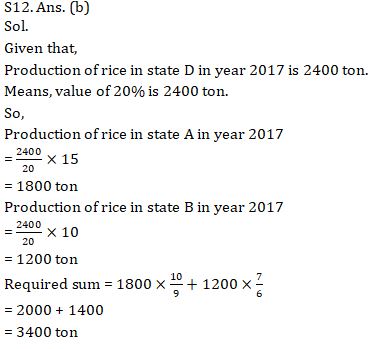
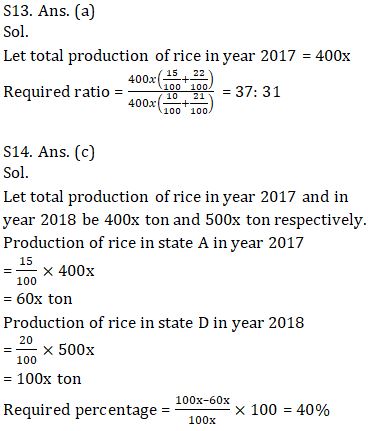
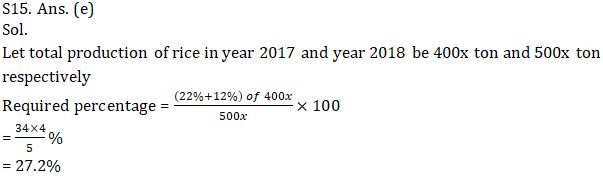
Direction (11-15): Given below is the pie chart which shows the percentage distribution of production of rice in six states i.e. A, B, C, D, E and F in year 2017.
Note: Ratio of total production of rice in these six states in year 2017 to year 2018 is 4 : 5.
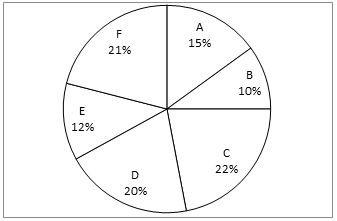
Q11. If difference between the total production of rice in year 2017 and year 2018 is 3000 ton then find the sum of total production of rice in state C and E together in year 2017.
(a) 3820
(b) 4140
(c) 3980
(d) 4080
(e) 4020
Q13. What is the ratio of total production of rice from state A and C together in year 2017 to the total production of rice from state B and F together in same year.
(a) 37 : 31
(b) 33 : 37
(c) 32 : 29
(d) 35 : 33
(e) 36 : 37
Q14. If percentage distribution of production of rice in year 2018 is same as in year 2017 for each state then production of rice in state A in year 2017 is what percent more or less than production of rice in state D in year 2018.
(a) 46%
(b) 42%
(c) 40%
(d) 45%
(e) 48%
Q15. Total production of rice from state C and E together in year 2017 is what percent of total production of rice in year 2018 from all states.
(a) 26.2%
(b) 26.8%
(c) 27.8%
(d) 26.4%
(e) 27.2%
Practice More Questions of Quantitative Aptitude for Competitive Exams:
Quantitative Aptitude for Competitive Exams |
Quantitative Aptitude Quiz For ECGC PO 2021- 13th February |
Quantitative Aptitude Quiz For ECGC PO 2021- 12th February |
ECGC PO Study Plan 2021 |
Solutions
Practice with Crash Course and Online Test Series for ECGC PO 2021:
- ECGC Online Coaching Classes for Probationary Officier 2021
- ECGC PO Mock Tests 2021 – Banking Online Test Series (With Solutions) by Adda247
- ECGC PO 2021 Complete eBooks Kit (English Medium)
Click Here to Register for Bank Exams 2020 Preparation Material


 IBPS Calendar 2026-27 Out @ibps.in for P...
 HPSCB Junior Clerk Exam Date 2026, Check...
 DSSSB IT Assistant Vacancy 2026 Notifica...


