

Directions (1-5): – Table given below shows total number of employees (in % out of total employees) working in given companies. Study the data carefully and answer the following questions
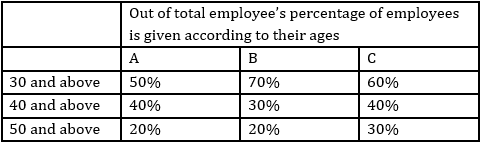
Total employees in A = 1200
Total employees in B = 800
Total employees in C = 900
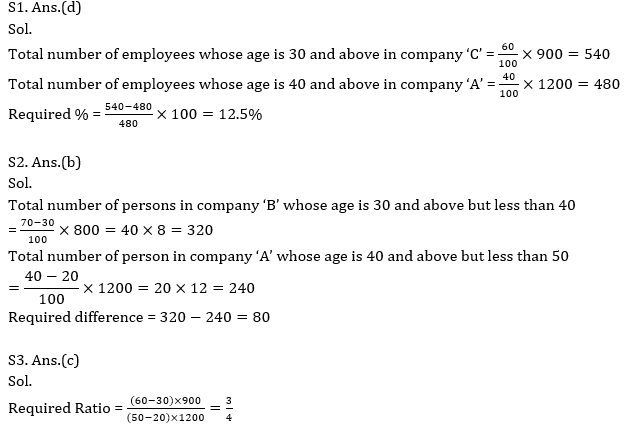
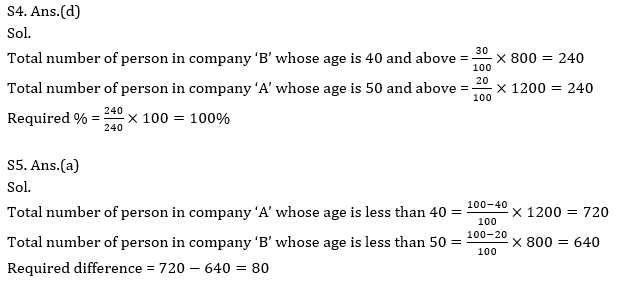
Q1.Total number of employees whose age is 30 and above in company ‘C’ is what percent more than total number of employees who age is 40 and above in company ‘A’.
(a) 50%
(b) 37.5%
(c) 25%
(d) 12.5%
(e) 10%
Q2. Total number of persons in company ‘B’ whose age is 30 and above but less than 40 is how much more than total number of person in company ‘A’ whose age is 40 and above but less than 50.
(a) 60
(b) 80
(c) 100
(d) 120
(e) 140
Q3.Find the ratio between total number of employees in company ‘C’ whose age is 30 and above but less than 50 to total number of employees in company ‘A’ whose age is 30 and above but less than 50.
(a) 9 : 8
(b) 1 : 2
(c) 3 : 4
(d) 4 : 3
(e) 1 : 4
Q4. Total number of person in company ‘B’ whose age is 40 and above is what percent of the total number of person in company ‘A’ whose age is 50 and above.
(a) 50%
(b) 0%
(c) 200%
(d) 100%
(e) 150%
Q5. Total number of person in company ‘A’ whose age is less than 40 is how much more/less than total number of person in company ‘B’ whose age is less than 50.
(a) 80
(b) 160
(c) 40
(d) 120
(e) 200
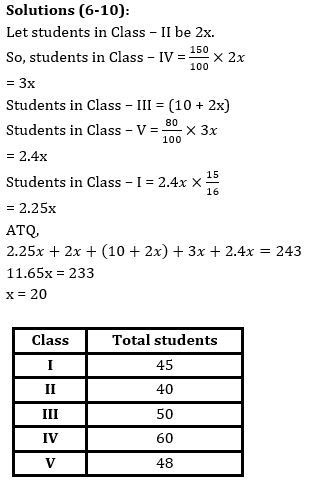
Directions (6-10): Study the passage given below carefully and answer the following questions.
In a school, there are total of 243 students in 5 classes (i.e. class – I, II, III, IV & V). Students in Class – IV are 50% more than students in Class – II and students in Class – III are 10 more than students in Class – II. Students in Class – V are 80% of students in Class – IV and ratio of students in Class – I to that of in Class – V is 15 : 16.
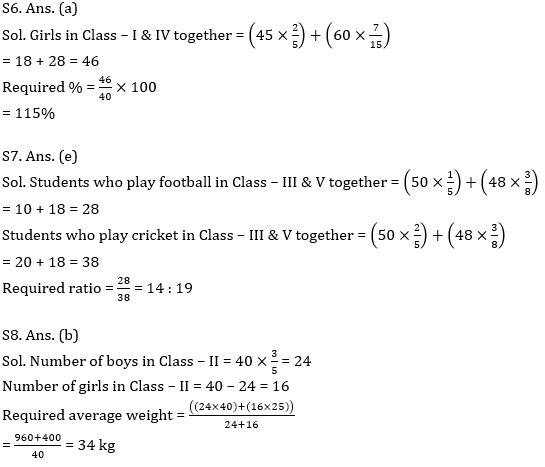
Q6. If ratio of boys to girls in Class – I & IV is 3 : 2 and 8 : 7 respectively, then find number of girls in Class – I & IV together is what percent of total students in Class – II?
(a) 115%
(b) 130%
(c) 120%
(d) 135%
(e) 125%
Q7. If ratio of students who play basketball, football and cricket in Class – III & V is 2 : 1 : 2 and 2 : 3 : 3 respectively, then find ratio of students who play football in these 2 classes together to students who play cricket in these two classes together.
(a) 11 : 9
(b) 1 : 1
(c) 7 : 4
(d) 6 : 1
(e) None of the above.
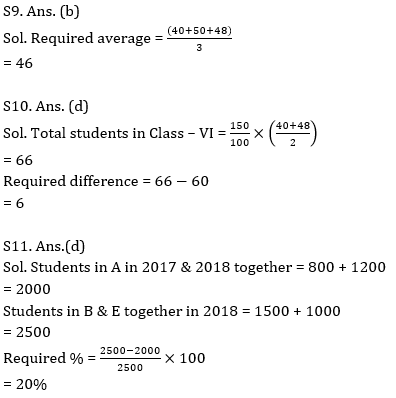
Q8. If ratio of girls to boys in Class – II is 2 : 3 and average weight of boys in Class – II is 40kg and average weight of girls in Class – II is 25kg, then find the average weight of Class – II.
(a) 33 kg
(b) 34 kg
(c) 37 kg
(d) 36 kg
(e) 35 kg
Q9. Find average number of students in Class – II, III & V.
(a) 52
(b) 46
(c) 45
(d) 42
(e) 49
Q10. If total students in Class – VI are equal to 150% of average number of students in Class – II & V, then find difference between total students in Class – VI and total students in Class – IV.
(a) 18
(b) 9
(c) 12
(d) 6
(e) 15
Directions (11-15): Study the radar chart given below and answer the following questions. Radar chart shows the number of students (in ’00) in 5 different schools (A, B, C, D & E) in 2017 & 2018.
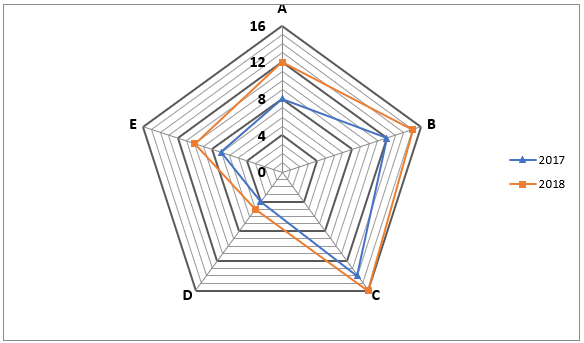
Q11. Students in A in 2017 & 2018 together are what percent more or less than students in B & E together in 2018?
(a) 80%
(b) 30%
(c) 50%
(d) 20%
(e) 60%
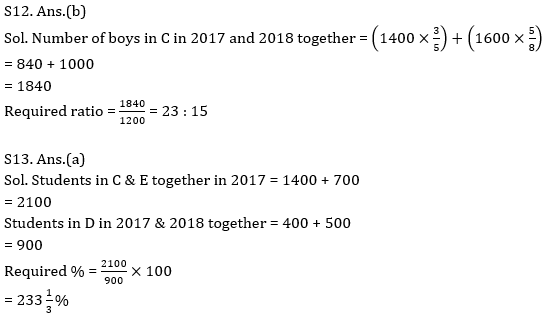
Q12. If ratio of boys to girls in C in 2017 and 2018 is 3 : 2 and 5 : 3 respectively, then find ratio of number of boys in C in 2017 and 2018 together to total students in B in 2017.
(a) 7 : 5
(b) 23 : 15
(c) 3 : 2
(d) 21 : 13
(e) 4 : 3
Q14. If total students in F in 2017 are 900 more than total students in E in 2017 and ratio of boys to girls in B & F in 2017 is 11 : 9 and 3 : 7 respectively, then find number of girls in B & F together in 2017.
(a) 1450
(b) 1280
(c) 1340
(d) 1660
(e) None of the above.
Q15. Average number of students in B, C & D in 2018 are how much more or less than students in A & E together in 2017?
(a) 100
(b) 200
(c) 300
(d) 500
(e) 400
Practice More Questions of Quantitative Aptitude for Competitive Exams:
Quantitative Aptitude for Competitive Exams |
Quantitative Aptitude Quiz For ECGC PO 2021- 24th February |
Quantitative Aptitude Quiz For ECGC PO 2021- 23rd February |
ECGC PO Study Plan 2021 |
Solutions
Practice with Crash Course and Online Test Series for ECGC PO 2021:
- ECGC Online Coaching Classes for Probationary Officier 2021
- ECGC PO Mock Tests 2021 – Banking Online Test Series (With Solutions) by Adda247
- ECGC PO 2021 Complete eBooks Kit (English Medium)
Click Here to Register for Bank Exams 2020 Preparation Material


 SBI Apprentice Recruitment 2026 Notifica...
 SBI Apprentice Salary 2026, Salary Struc...
 Bank of Baroda Apprentice Syllabus and E...


