

Direction (1 -5): Read the data carefully and answer the questions.
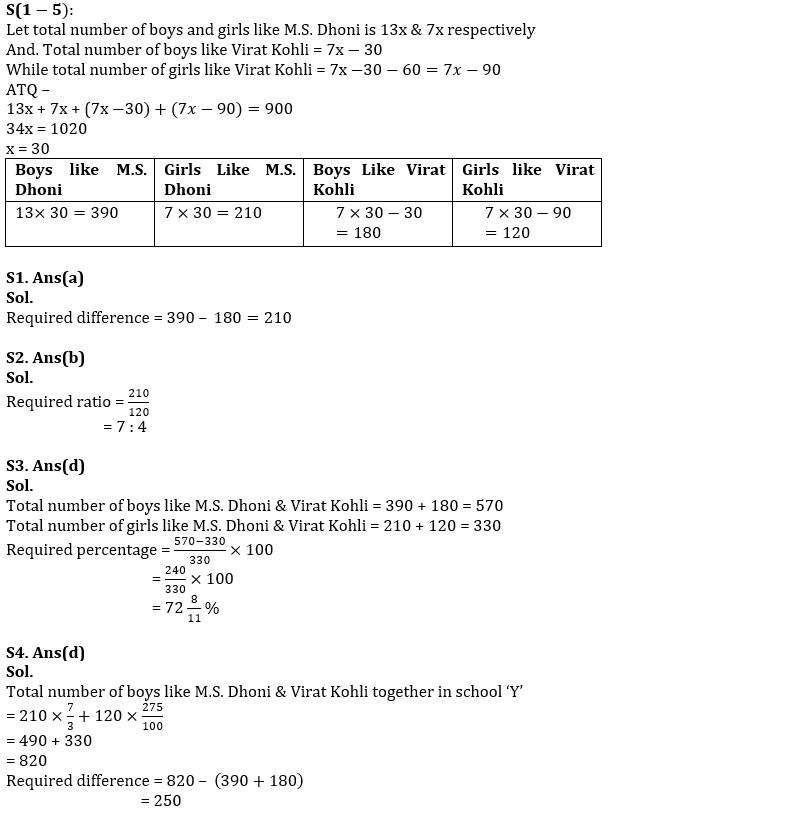
There are 900 students in school ‘X’ and they like two Indian cricket players, i.e. either Virat Kohli or M.S. Dhoni. The ratio of boys to girls like M.S. Dhoni is 13 : 7 and total number of boys like Virat Kohli is 30 less than total number of girls like M.S. Dhoni. Total number of girls like Virat Kohli is 60 less than boys like Virat Kohli.
Q1. Find difference between total number of boys like M.S. Dhoni & total number of boys like Virat Kohli?
(a) 210
(b) 220
(c) 225
(d) 230
(e) 250
Q2. Find the ratio between total number of Girls Like M.S. Dhoni to total number of Girls Like Virat kohli?
(a) 8 : 5
(b) 7 : 4
(c) 7 : 3
(d) 7 : 2
(e) 7 : 9
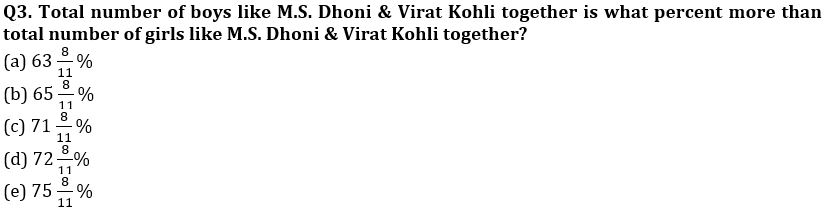
Q4. In school ‘Y’ number of boys like M.S. Dhoni and Virat Kolhi is 133 ⅓% & 175% more than total number of girls like M.S. Dhoni & Virat Kolhi in school ‘X’ respectively. Find difference between total number of boys like M.S. Dhoni & Virat Kohli together in school ‘X’ to total number of boys like M.S. Dhoni & Virat Kohli together in school ‘Y’?
(a) 225
(b) 220
(c) 230
(d) 250
(e) 260
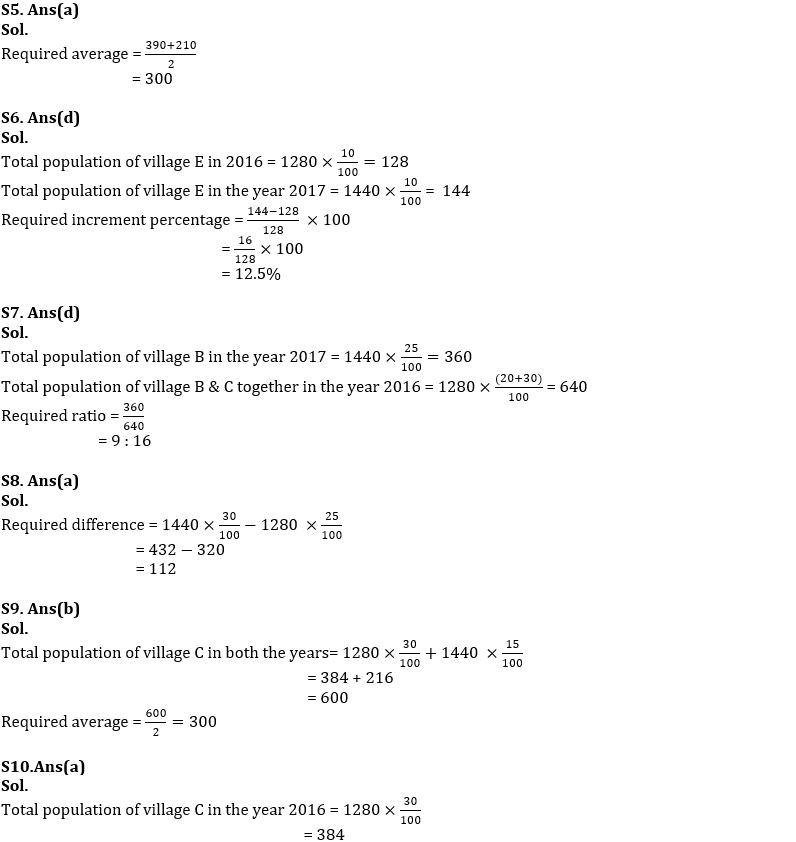
Q5. Find average number of Boys & girls like M. S. Dhoni?
(a) 300
(b) 275
(c) 320
(d) 360
(e) 250
Direction (6 -10): Given below pie chart shows percentage distribution of population of five village in two different years (2016 & 2017). Read data carefully and answer the questions.
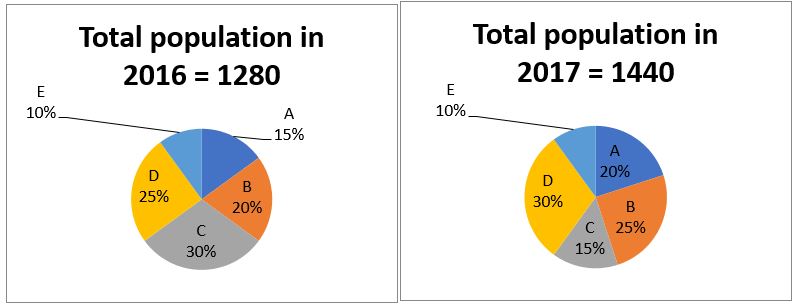 Q6. Find increment percentage of population of village E in the year 2017 over the 2016?
(a) 7.5%
(b) 8.5%
(c) 11.5%
(d) 12.5%
(e) 10.5%
Q7. Find the ratio between total population of village B in the year 2017 to total population of village B & C together in the year 2016?
(a) 8 : 15
(b) 9 : 11
(c) 9 : 17
(d) 9 : 16
(e) 9 : 19
Q8. Find difference between population of village D in the year 2017 and village D in the year 2016?
(a) 112
(b) 110
(c) 108
(d) 104
(e) 112
Q9. Find the average number population of village C in the both given years?
(a) 240
(b) 300
(c) 250
(d) 320
(e) 360
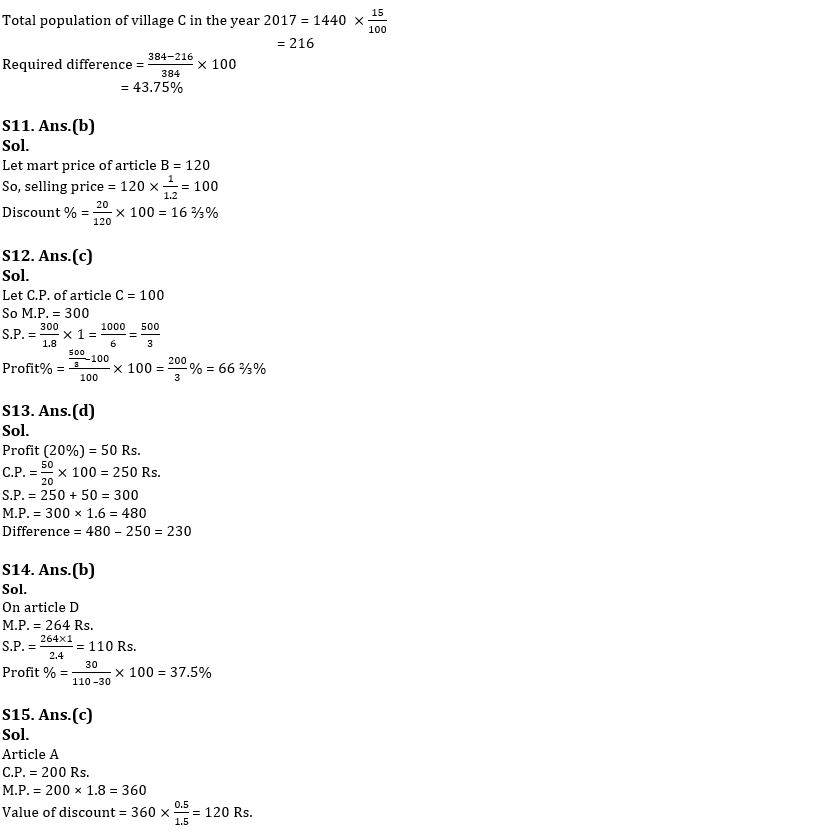
Q10. Find decrement percentage in population of village C in the year 2017 over the year 2016?
(a) 43.75%
(b) 44.75%
(c) 47.25%
(d) 48.75%
(e) 50.25%
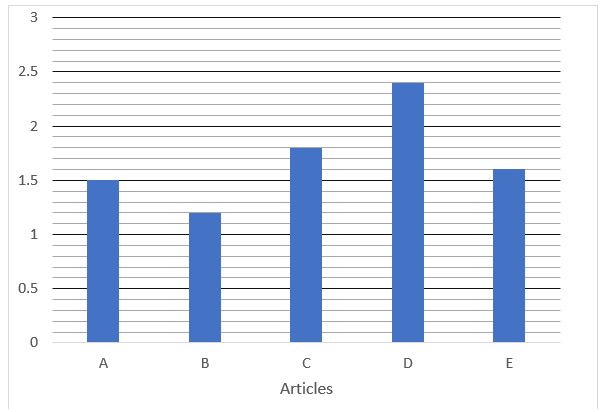
Directions (11-15): Given bar graph shows the ratio of marked price to selling price of five articles sold by a shopkeeper. Read the information carefully and answer the following questions.
Q11. What is the discount% on article B.
(a) 205
(b) 16 ⅔%
(c) 40%
(d) 8 ⅓%
(e) 50%
Q12. If mark price of article C is 200% above cost price then find the profit % an selling article C.
(a) 33 ⅓%
(b) 16 ⅔%
(c) 66 ⅔%
(d) 48 ½%
(e) 50%
Q13. On article E shopkeeper earn 50 Rs. which is 20% of C.P. what is the difference between cost price and mark price of article.
(a) 240 Rs.
(b) 210 Rs.
(c) 245 Rs.
(d) 230 Rs.
(e) 235 Rs.
Q14. Mark price of article D is 264 Rs. If profit is 30 Rs. then find the profit % on it.
(a) 32%
(b) 37.5%
(c) 12.25%
(d) 25%
(e) 27%
Q15. Article A has cost of 200 Rs. if mark price is 80% above cost price then find value of discount on it.
(a) 200 Rs.
(b) 150 Rs.
(c) 120 Rs.
(d) 110 Rs.
(e) 140 Rs.
Solutions


 Data Interpretation Questions for IBPS R...
 Data Interpretation Questions For Bank E...
 Data Interpretation Questions for SBI PO...


