

Directions (1-5): Study the bar chart given below and answer the following questions.
Bar chart shows the total votes (in ‘000) in 5 different cities (A, B, C, D & E) and percentage of valid votes out of total votes in these 5 cities.
![]()
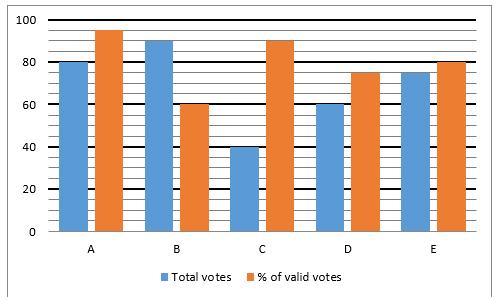
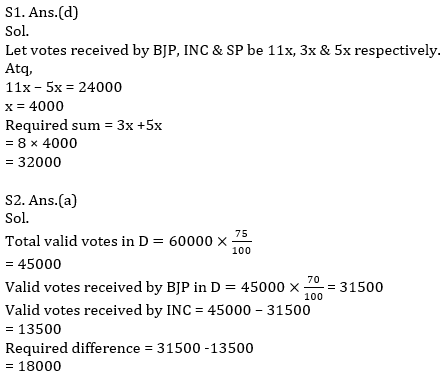
Q1. In A, ratio of valid votes received by BJP, INC & SP is 11 : 3 : 5. If BJP win the election by 24000 votes, then find valid votes received by INC & SP together.
(a) 28000
(b) 40000
(c) 45000
(d) 32000
(e) 21000
Q2. If in D there are only two parties-BJP & INC and BJP got 70% of the total valid votes, then find by how many votes BJP won the election in D.
(a) 18000
(b) 25000
(c) 10000
(d) 16000
(e) 6000
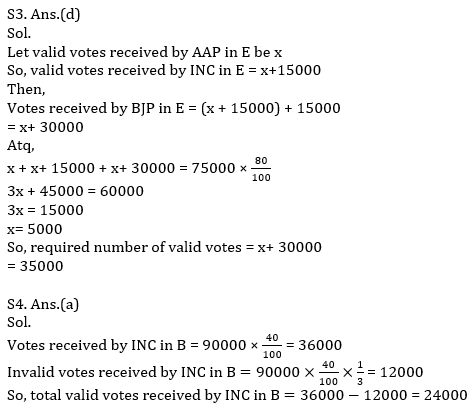
Q3. If in E INC got 15000 more valid votes than AAP and BJP won the election by 15000 votes, then find the valid votes received by BJP. (There are only three parties in E – BJP, INC & AAP)
(a) 40000
(b) 38000
(c) 45000
(d) 35000
(e) 30000
Q4. In B there are only two parties – BJP & INC. If BJP got 60% of total votes in B and ratio of invalid votes received by BJP and INC is 2 : 1, then find valid votes received by INC in B.
(a) 24000
(b) 27000
(c) 22000
(d) 20000
(e) 25000
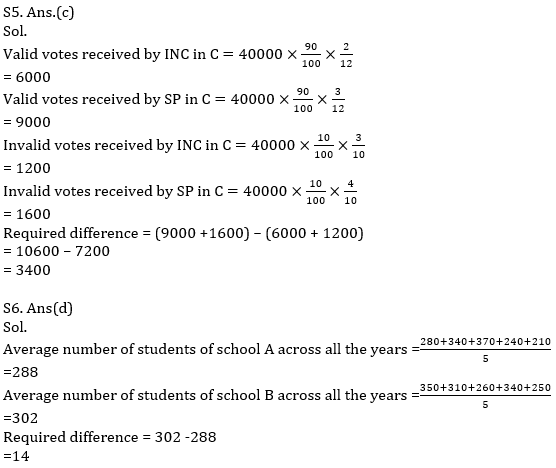
Q5. In C there are four parties – BJP, INC, SP & AAP. If ratio of valid votes received by BJP, INC, SP & AAP in C is 4 : 2 : 3 : 3 and ratio of invalid votes received by BJP, INC, SP & AAP in C is 1 : 3 : 4 : 2, then find difference between total votes received by INC & SP in C.
(a) 2000
(b) 3500
(c) 3400
(d) 2100
(e) 2700
Directions (6-10):- Given bar graph shows the details of number of students in a particular class of 3 different schools in 5 different years.
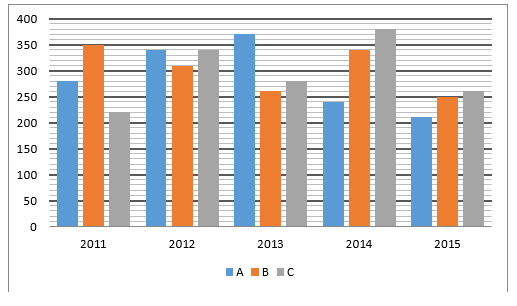
Q6.What is the difference between average number of students of school A across all the years and the average number of students of school B across all the years?
(a) 18
(b) 10
(c) 12
(d) 14
(e) 16
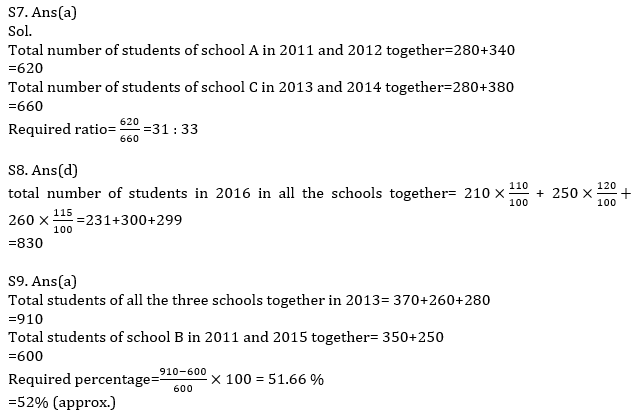
Q7.Find the respective ratio of the total number of students of school A in 2011 and 2012 together to the total number of students of school C in 2013 and 2014 together?
(a) 31:33
(b) 47:55
(c) 55:47
(d) 33:31
(e) 31:37
Q8.If in 2016, the total number of students in School A, School B and School C increases by 10%,20% and 15% respectively as compared to 2015, then find the total number of students in 2016 in all the schools together?
(a) 850
(b) 870
(c) 780
(d) 830
(e) 800
Q9.Total students of all the school together in 2013 is approximately what percentage more/less than the total students of school B in 2011 and 2015 together?
(a) 52%
(b) 59%
(c) 56%
(d) 63%
(e) 48%
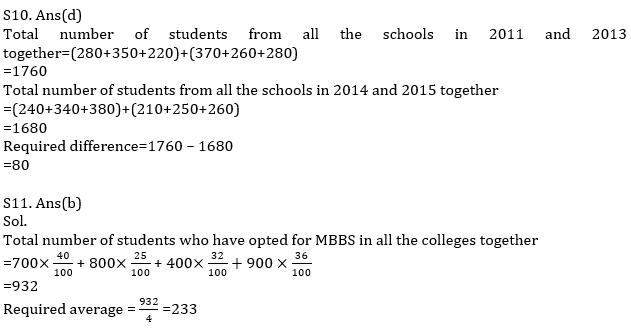
Q10.Find the difference between the number of total students from all the schools in 2011 and 2013 together and the total number of students from all the schools in 2014 and 2015 together?
(a) 140
(b) 60
(c) 120
(d) 80
(e) 100
Directions (11-15): Given bar graph shows the percentage distribution of total number of students of each school (P, Q, R & S) who took admission in 3 different streams. Total students in P, Q, R & S are 700, 800, 400 & 900 respectively.
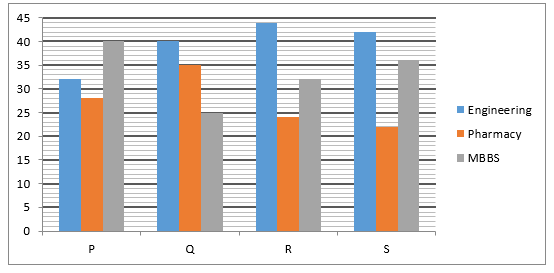
Q11.What is average number of students who have opted for MBBS in all the 4 colleges?
(a) 256
(b) 233
(c) 284
(d) 224
(e) 296
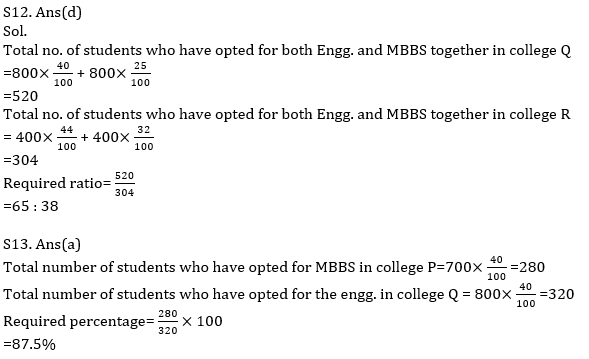
Q12.What is the ratio of the total number of student who have opted for both engg. and MBBS stream together in college Q to that of in same stream together in college R?
(a) 38:65
(b) 67:35
(c) 35:67
(d) 65:38
(e) 29:37
Q13. The number of student who have opted for MBBS in college P is what percent of the number of students who have opted for the engg. in college Q?
(a) 87.5%
(b) 50%
(c) 75%
(d) 100%
(e) 62.5%
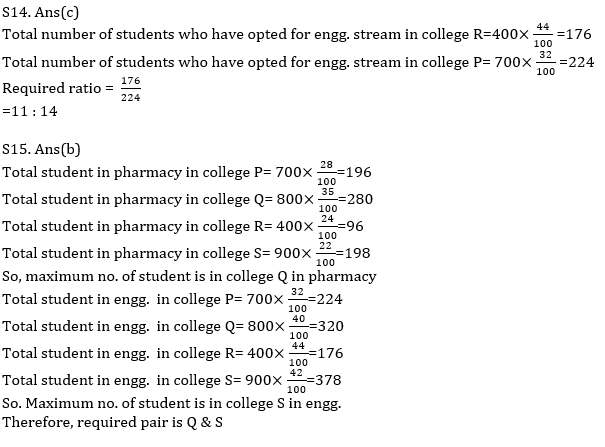
Q14.What is the ratio of the no. of students who have opted for engg. in college R to that of those who have opted for same stream in college P?
(a) 14:11
(b) 17:13
(c) 11:14
(d) 13:17
(e) None of these
Q15.Which of the combination represents the colleges with maximum number of students, who have opted for pharmacy and those who have opted for engg. respectively?
(a) P & R
(b) Q & S
(c) Q & R
(d) R & S
(e) P & Q
Solutions

Click Here to Register for Bank Exams 2021 Preparation Material


 AAICLAS Recruitment 2026 Notification Ou...
 SBI PO Salary 2026, Revised Salary Struc...
 World Environment Day 2026, History, The...


