
Directions (1-5): Study the charts given below and answer the following questions.
Line chart shows the number of units sold of five different articles (A, B, C, D and E) in 3 different years (2015, 2016 and 2017) and table shows per unit price of these articles in these years.

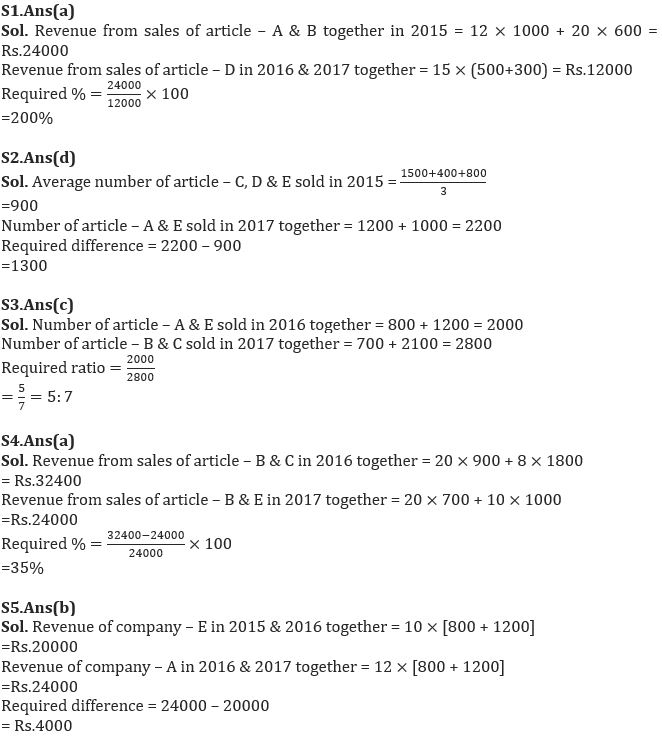
Q1. Find revenue from sales of article-A & B together in 2015 is what percent of revenue from sales of article-D in 2016 and 2017 together?
(a) 200%
(b) 120%
(c) 180%
(d) 160%
(e) 240%
Q2. Find average number of article-C, D & E sold in 2015 is how much more or less than number of article-A & E sold in 2017 together?
(a) 200
(b) 800
(c) 500
(d) 1300
(e) 900
Q3. Find ratio of number of article-A & E sold in 2016 together to number of article-B & C sold in 2017 together.
(a) 1 : 5
(b) 2 : 3
(c) 5 : 7
(d) 2 : 7
(e) 4 : 9
Q4. Revenue from sales of article-B & C in 2016 together is what percent more or less than revenue from sales of article-E & B in 2017 together?
(a) 35%
(b) 50%
(c) 15%
(d) 40%
(e) 25%
Q5. Revenue of company-E in 2015 & 2016 together is how much more or less than revenue of company-A in 2016 & 2017 together?
(a) Rs.5200
(b) Rs.4000
(c) Rs.7000
(d) Rs.6500
(e) Rs.3600
Directions (6-10): Data given below gives the information regarding four different products A, B, C and D (in units) sold by a company in year 2014 and 2015. Read the data carefully to answer the following questions.
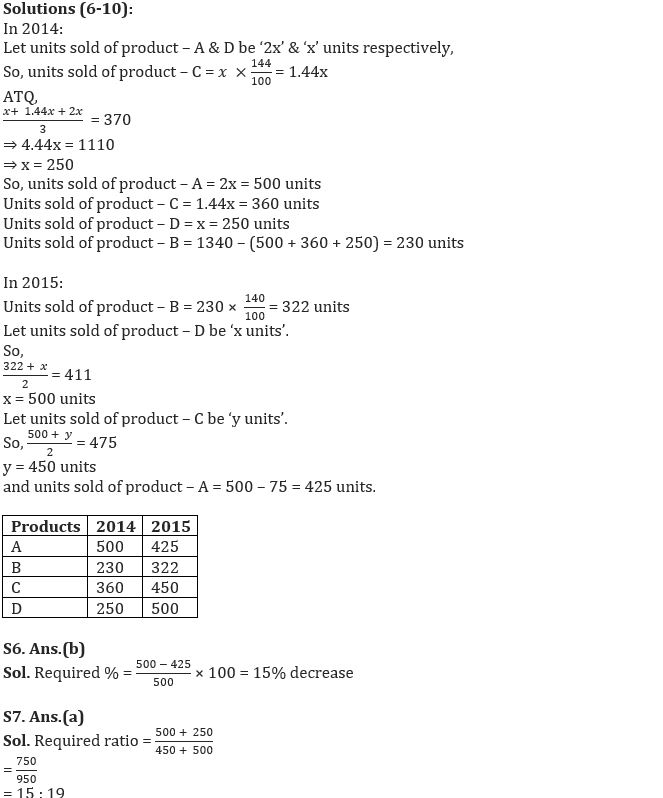
In 2014 – Ratio of units sold of product A to product D is 2 : 1. Units sold of product C is 144% of units sold of product D. Average number of units sold of product A, C and D is 370 units. Total units sold of product A, B, C and D is 1340 units.
In 2015 – Average number of units sold of product C & D is 475 units. Units sold of product A is 75 units less than the units sold of product D. Units sold of product B is increased by 40% as compared to previous year and average units sold of product B & D is 411 units.
Q7. Find the ratio of units sold of product A & D together in 2014 to units sold of product C & D together in 2015.
(a) 15 : 19
(b) 12 : 17
(c) 5 : 3
(d) 9 : 7
(e) 11 : 6
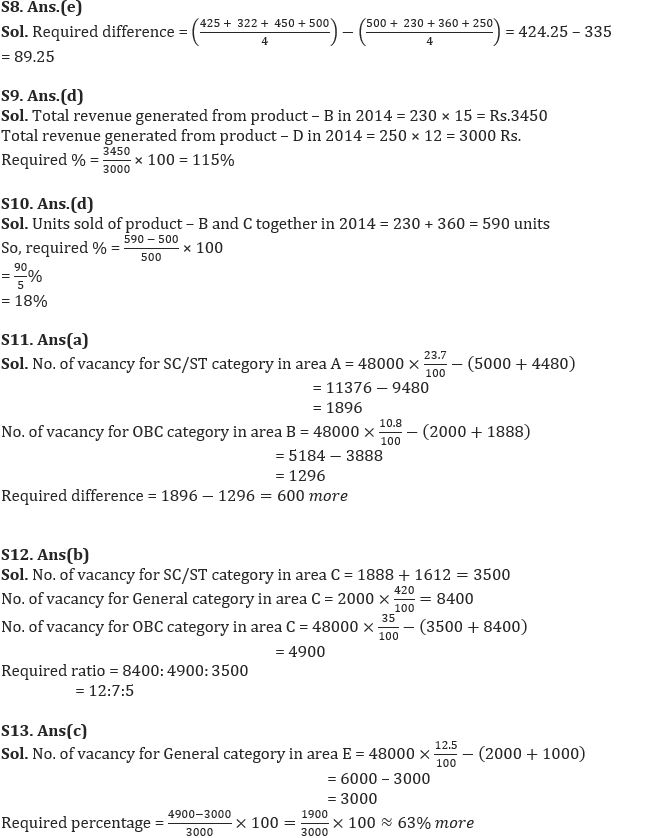
Q8. Find the difference in average units sold of product A, B, C and D in 2014 and average units sold of product A, B, C and D in 2015.
(a) 67.25
(b) 73.25
(c) 82.25
(d) 87.25
(e) 89.25.
Q9. In 2014, selling price of per unit of product D is Rs.12 and selling price of per unit of product B is Rs.15. Find total revenue generated from product B in 2014 is what percent of total revenue generated from product D in 2014?
(a) 125%
(b) 145%
(c) 135%
(d) 115%
(e) 105%
Q10. Units sold of product B & C together in 2014 is what percent more than units sold of product – D in 2015?
(a) 12%
(b) 30%
(c) 24%
(d) 18%
(e) 36%
Directions (11-15): – Pie chart given below shows percentage distribution of vacancy issued for the post of clerk by RRB in five different area and table shows distribution of no. of vacancy for three different categories i.e. (General, OBC, and SC/ST). Some data is missing in the table you have to calculate the data according to given information and answer the following questions.
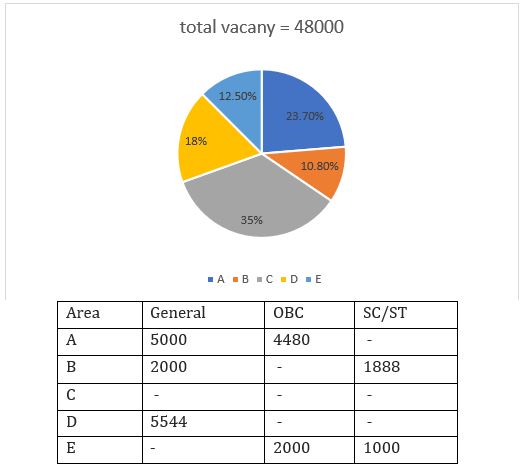
Q11. Vacancy for SC/ST category in area A is how much more or less than no. of vacancy for OBC category in area B?
(a) 600 more
(b) 500 less
(c) 400 less
(d) 600 less
(e) 400 more
Q12. If in area C vacancy for General and SC/ST category is 320% more and 1612 more than vacancy of same category in area B respectively, find ratio of vacancy for General, OBC and SC/ST category in area C?
(a) 11:9:4
(b) 12:7:5
(c) 12:5:1
(d) 6:5:1
(e) None of these.
Q13. No. of vacancy for OBC category in area C is approximately how much percent more or less than no. of vacancy for General in area E? (use information of question no. 42)
(a) 63% less
(b) 60% less
(c) 63% more
(d) 67% more
(e) 68% less
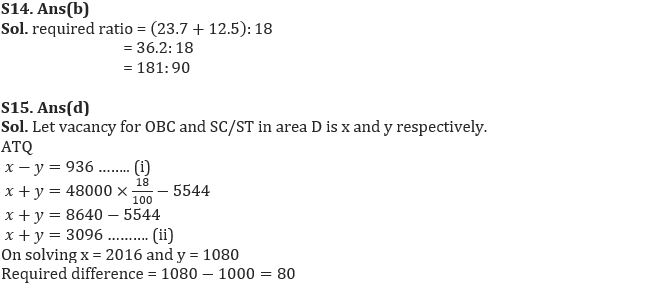
Q14. What is the ratio of total vacancy in area A and E together to total vacancy in area D?
(a) 2:1
(b) 181:90
(c) 161:90
(d) 4:5
(e) 121:70
Q15. If in area D, difference between vacancy for OBC and SC/ST (OBC>SC/ST) is 936, then find vacancy for SC/ST in area D is how much more than vacancy for same category in area E?
(a) 100
(b) 108
(c) 64
(d) 80
(e) 120
Solutions


 JAIIB Syllabus & Exam Pattern 2026, ...
 Daily Current Affairs and GK Updates (4t...
 Puzzle Questions for SBI PO Exam


